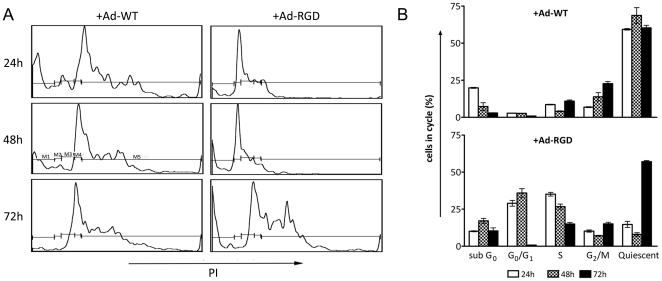
Figure 6. T cells transduced with oncolytic Ad-RGD undergo rapid cell cycle.
(A) Flow cytometric profile of propidium iodide (PI) dilution in virus-transduced T cells at different time-points after treatment. Gates drawn on different cell-cycle phases are M1 sub-G0, M2 G0/G1, M3 S, M4 G2/M and M5 quiescent. Left panel shows cells treated with adenovirus with wild-type fiber (Ad-WT). Right panel shows cells with RGD-modified oncolytic virus (Ad-RGD). (B). Bar diagram representation of the cell-cycle. Top panel represents cells treated with Ad-WT. Bottom panel represents cells treated with Ad-RGD. White bars are cells after 24 h, while patterned and black bars are cells after 48 and 72 h respectively after virus transduction. Error bars represent mean ± SD.

