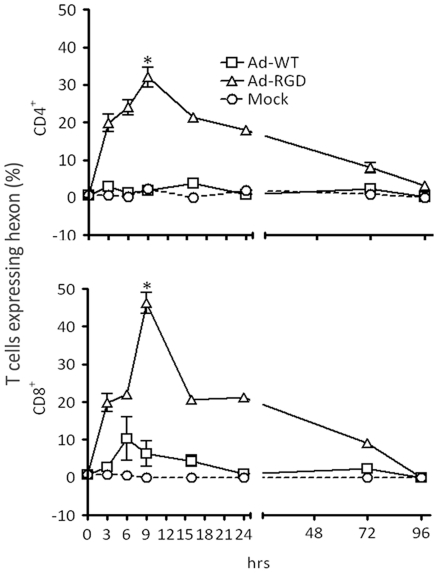
Figure 7. Efficient in vivo transduction of mouse T cells by Ad-RGD.
Three groups of B6 mice were injected via tail-vein with Ad-WT (open squares), Ad-RGD (open triangles) and PBS (open circles) respectively. Animals were sacrificed at 0, 3, 6, 9, 16, 24, 72 and 96 h after virus injection and spleens were harvested. Splenocytes were surface stained for CD4 and CD8 and then fixed and permeablized and stained with anti-hexon antibody for flow-cytometric analysis of adenovirus infected splenic T cells. Percentage of CD4+ T cells expressing adenoviral hexon antigen is represented in upper panel and CD8+ T cells are in lower panel. Error bars indicate standard deviation from three animals per group of study. (*p<0.01;**p>0.05; N = 3)

