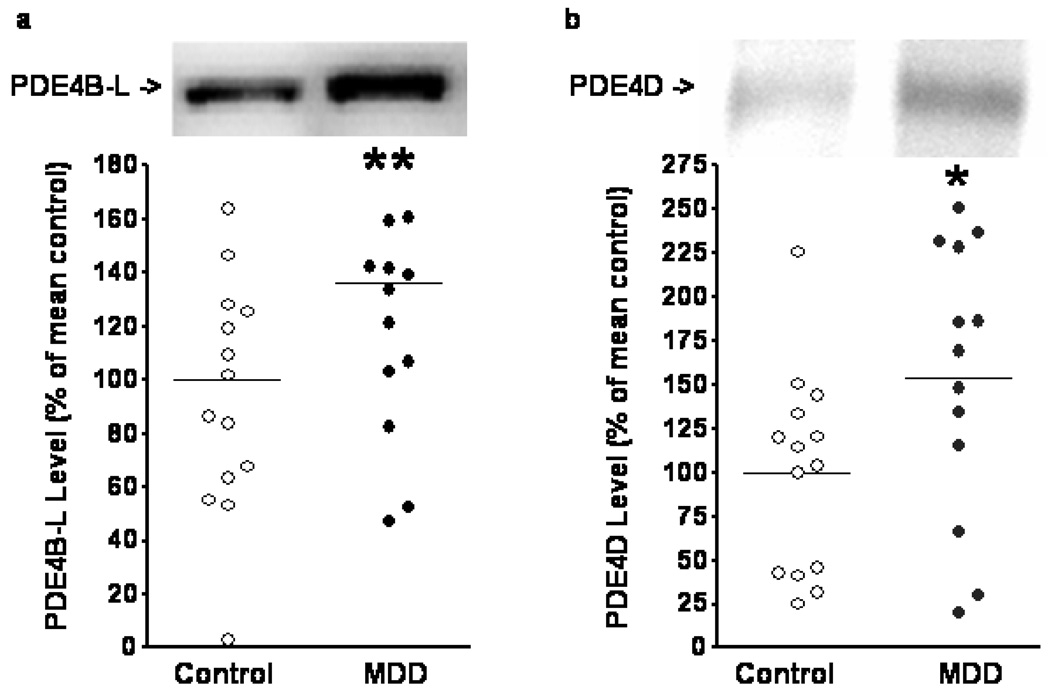
Figure 1.
Levels of PDE4 subtypes in cingulate cortical tissue from non-psychiatric controls and individuals with MDD. Tissues were processed and blotted for PDE4B-L (long form) (a) and PDE4D (b) as described in the Methods. Samples (one from each group) that did not show bands with expected molecular weight were excluded from the final analysis. There was a statistical trend toward elevation of PDE4B-L levels in the MDD group (t(28)=1.905, p=0.0671). Significantly elevated PDE4D levels were seen in the MDD group (t(25)=2.069, p=0.0491). Data are mean ± SD. *: p<0.05. **: p<0.1.

