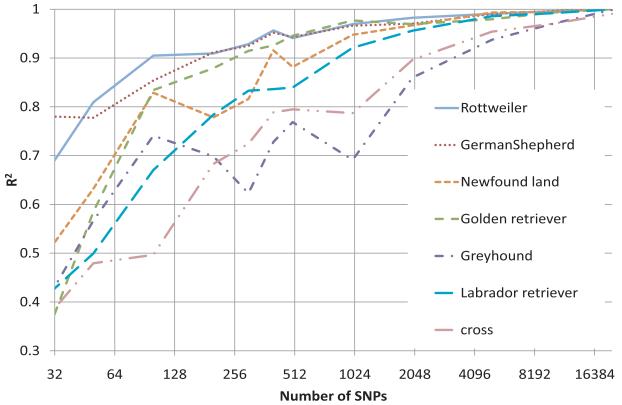
Figure 2.
Model fit of genomic breeding value and estimated breeding value. The model fit (R2) was displayed for each breed/cross over different number of the most influential SNPs. The cross included the first cross (F1) between Labrador retriever and Greyhound (G), backcross to LR (F1×LR), backcross to G (F1×G), and third generations cross: (F1×LR) × (F1×LR).

