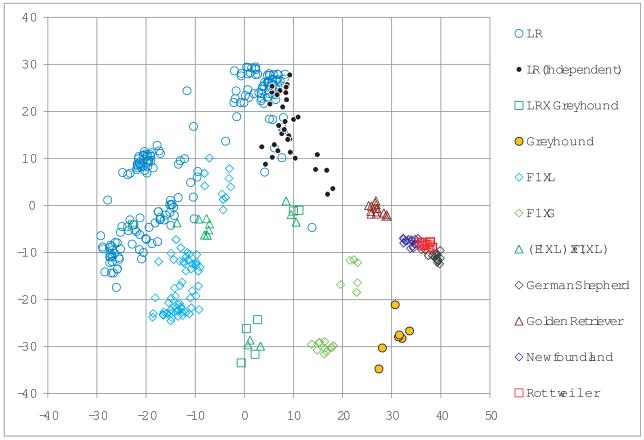
Figure 4.
Genetic relationship among dogs in the reference and independent sample. The genetic relationship was characterized by the first principal component (PC, X axis) and the second principal component (Y axis) of the SNP genotypes. The PCs were derived from the common 13,465 SNPs shared by the Illumina array and AffyMetrix Array. The Illumina array was used to genotype the reference population (359 dogs) and the Affymetrix SNP array was used to genotype the independent validation population (38). Fifteen dogs were genotyped on both platforms for the purpose of data quality control and imputation of missing SNPs. Different pure breeds and crosses are displayed separately. The crosses between Labrador retriever (LR) and Greyhound (G) include the first cross (F1), backcross to LR (F1×L), backcross to G (F1×G), and third generations cross: (F1×L) × (F1×L). The Labrador retrievers from the reference population and the independent validation population are also displayed separately to show the diversity between the two subgroups. The Labrador retrievers from the reference sample are displayed as LR and the ones from the independent sample is displayed as LR (Independent).

