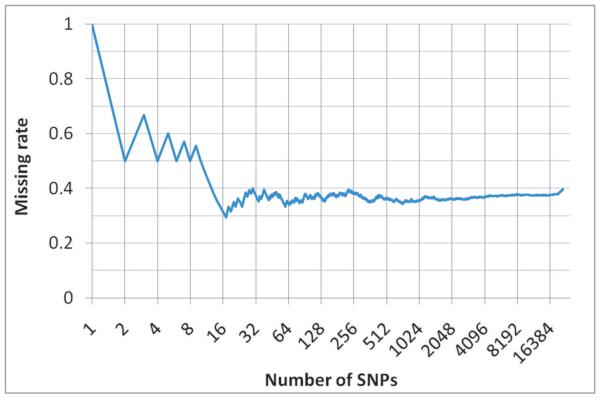
Figure 5.
Missing rate of single nucleotide polymorphisms (SNPs). There were 21,455 SNPs on Illumina array that was used to derive the predictive formula. About ~40% of these SNPs were not present on the Affymetrix array that was used to genotype the dogs for independent validation (including the first and the forth most influential SNPs on the Illumina array). The cumulative missing rates of SNPs are plotted against their order (descending log scale) based on their scaling factor.

