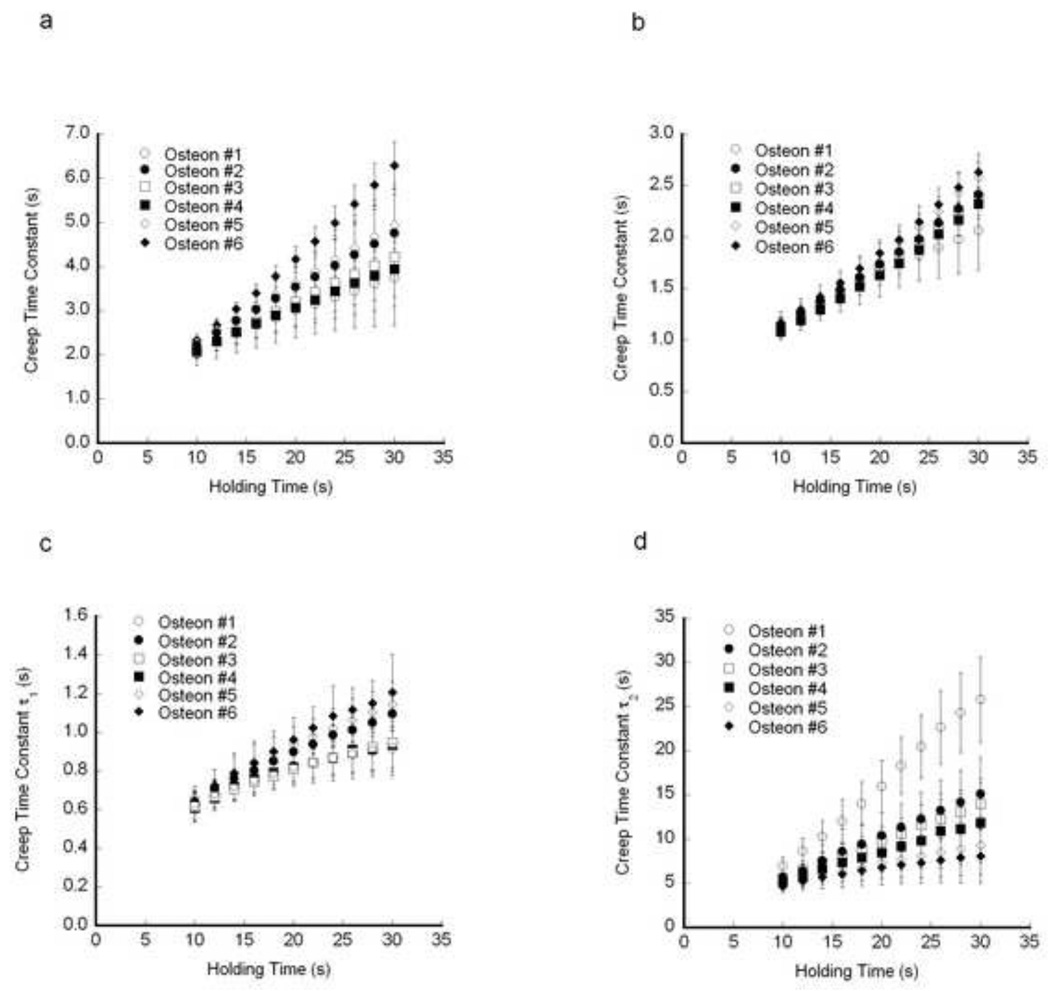
Figure 5.
The creep time constant increased with increasing holding time for each osteon within a representative sample. a) Standard Linear Solid model b) Burgers Model c) τ1 in Two-dashpot Kelvin Model. d) τ2 in Two-dashpot Kelvin Model. Error bars are one standard deviation (N=10 indents per osteon).

