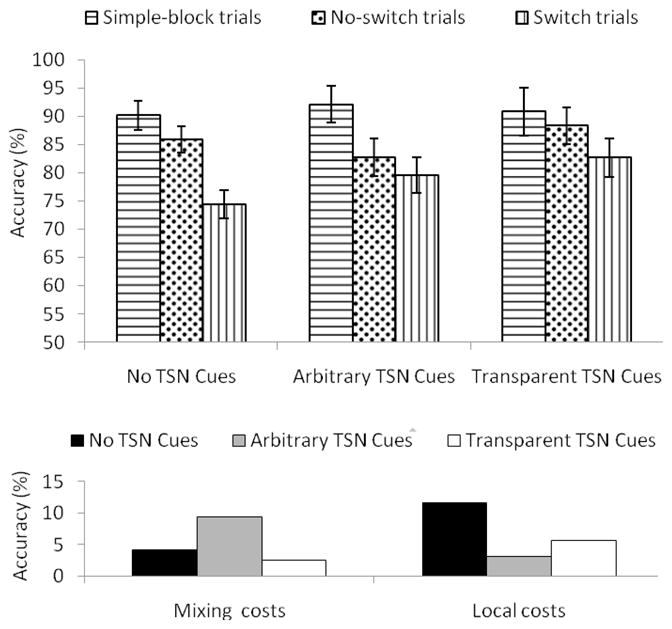
Figure 2.

Mean accuracy rates in percentage as a function of transition cues and trial types (top panel) and corresponding mixing costs and local costs (bottom panel). TSN = transition. Mixing costs correspond to the drop in performance between simple-block trials and no-switch trials. Local costs correspond to the drop in performance between no-switch trials and switch trials. Error bars indicate standard errors of the means.
