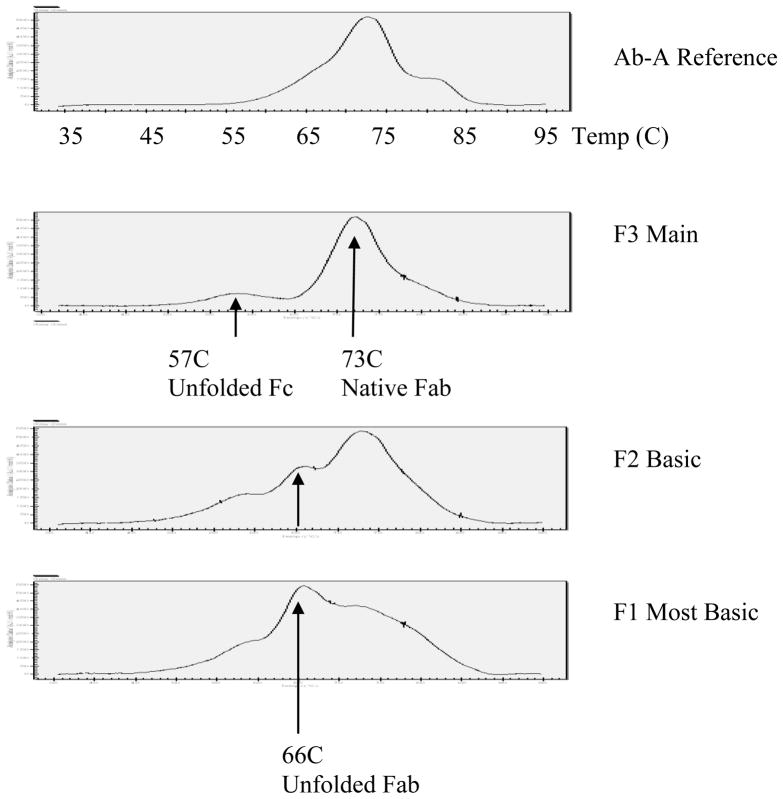
Figure 6.
Differential Scanning Calorimetry Analysis of Ab-A AEX Fractions. The Ab-A reference shows a typical antibody thermogram with a major temperature transition at 73C. The two basic peak fractions (F1 and F2) exhibit a shift to a lower TM at 66C representing unfolded Fab. The relative intensity for the most basic fraction (F1) characterized as di-oxidized at the CDR2 HC methionine by peptide mapping is approximately twice that of F2 (mono-oxidized). Hence, the results are consistent with partial unfolding of two Fab molecules in F1 and a single Fab in F2 of force-oxidized Ab-A.

