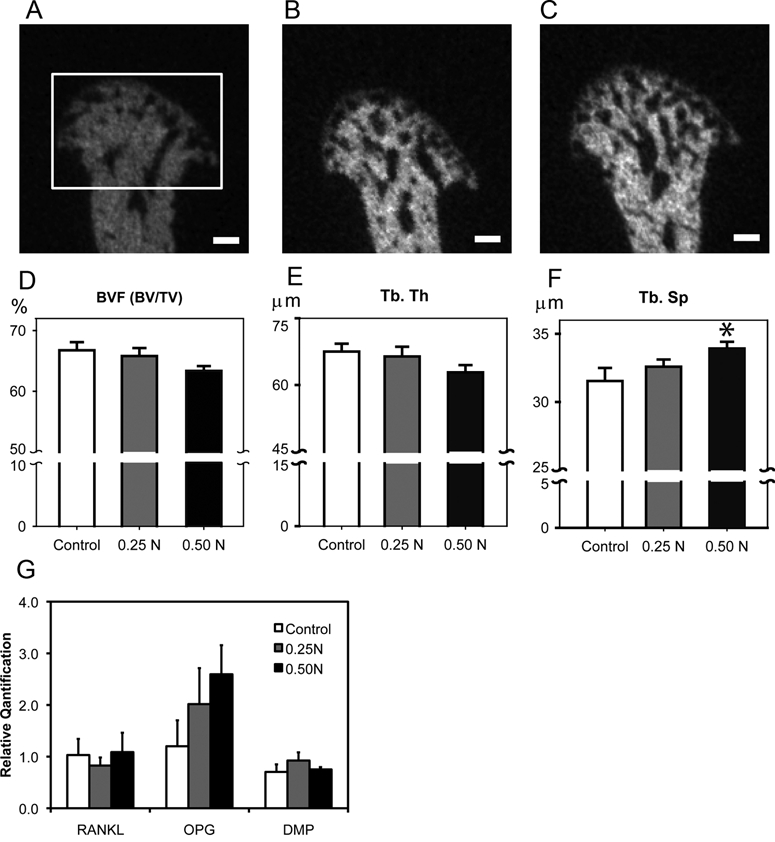
Figure 4.

Forced mouth opening causes an increase in trabecular spacing. (A,B,C) Micro-CT analysis of the subchondral bone. Representative images of mid-sagittal cross-sections from the mandibular condylar heads of 6-week-old female C57BL/6 mice exposed to (A) 0, (B) 0.25 N, and (C) 0.5 N of forced mouth opening. Bar: 100 µm. The framed area in (A) indicates the region of interest for the micro-CT analysis. (D,E,F) Micro-CT analysis of bone volume fraction (D), trabecular thickness (E), and trabecular spacing (F) from the mandibular condylar subchondral bone. (G) Real-time PCR analysis for RANKL, Opg, and Dmp-1 gene expressions from the mandibular condylar head. Points are the mean ± SE for n = 8 for each group. *Significant difference between 0.50 N forced mouth opening and control groups (p < 0.05).
