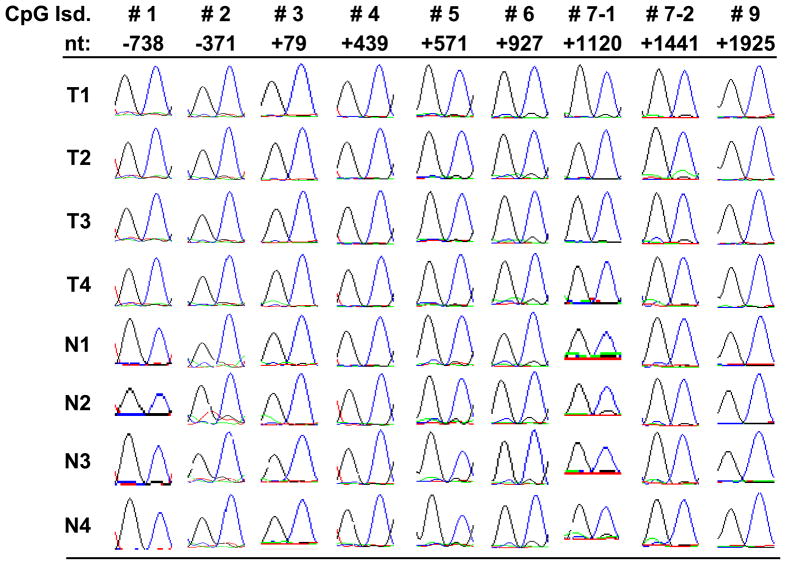
Figure 2. Representative sequencing results in ACC and normal salivary gland tissues.
We used bisulfite genomic sequencing to evaluate the DNA methylation levels of MYB CpG islands. Here we are showing the sequencing results (in chromatograph form) from randomly selected CpG sites within MYB CpG islands in four salivary ACC and four normal salivary gland tissues. Numbered CpG islands (CpG Isd) from #1 to #9 correspond to those shown in Figure 1. Nt indicates the position of selected CpG dinucleotides relative to the TSS of MYB. The blue peak stands for G; black, T; green, C; red, A. All CpG dinucleotides deomstrated dominant peaks of TG, which indicate unmethylated CpG. There was no discernible difference in methylation between ACC and normal salivary tissue.

