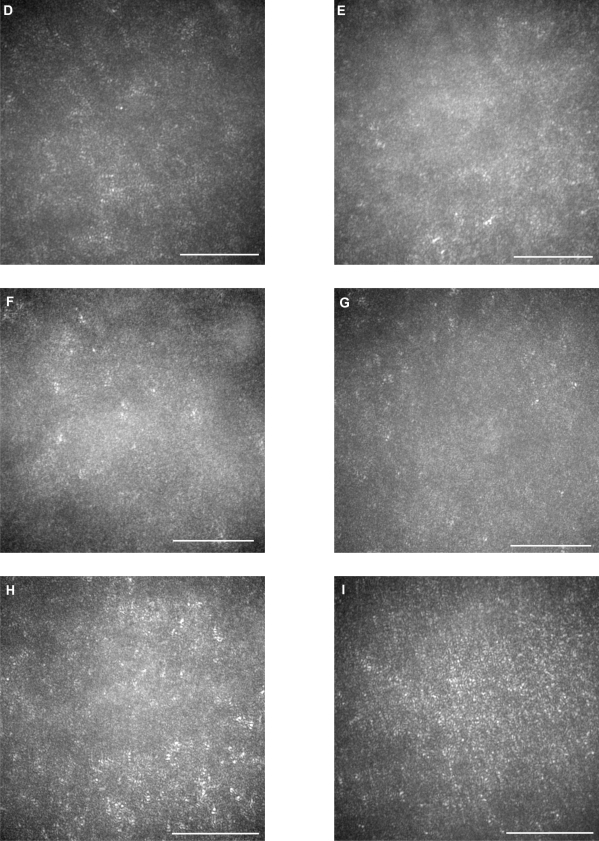
Figure 3.
Adaptive optics (AO) images of the fovea of a normal eye (A), and right/left eyes of patient 1 (B, C), patient 2 (D, E), patient 3 (F, G), and patient 4 (H, I). Bars represent 100 μm. In the eyes of the patients, signals from the cone mosaic were attenuated, and the bright spots were distorted (B–H). One eye which had normal visual acuity had an almost normal appearance in the foveal center, with some dark areas around the fovea.


