Abstract
Complex biological systems exhibit a property of robustness at all levels of organization. Through different mechanisms, the system tries to sustain stress such as due to starvation or drug exposure. To explore whether reconfiguration of the metabolic networks is used as a means to achieve robustness, we have studied possible metabolic adjustments in Mtb upon exposure to isoniazid (INH), a front-line clinical drug. The redundancy in the genome of M. tuberculosis (Mtb) makes it an attractive system to explore if alternate routes of metabolism exist in the bacterium. While the mechanism of action of INH is well studied, its effect on the overall metabolism is not well characterized. Using flux balance analysis, inhibiting the fluxes flowing through the reactions catalyzed by Rv1484, the target of INH, significantly changes the overall flux profiles. At the pathway level, activation or inactivation of certain pathways distant from the target pathway, are seen. Metabolites such as NADPH are shown to reduce drastically, while fatty acids tend to accumulate. The overall biomass also decreases with increasing inhibition levels. Inhibition studies, pathway level clustering and comparison of the flux profiles with the gene expression data indicate the activation of folate metabolism, ubiquinone metabolism, and metabolism of certain amino acids. This analysis provides insights useful for target identification and designing strategies for combination therapy. Insights gained about the role of individual components of a system and their interactions will also provide a basis for reconstruction of whole systems through synthetic biology approaches.
Electronic supplementary material
The online version of this article (doi:10.1007/s11693-011-9075-6) contains supplementary material, which is available to authorized users.
Keywords: Genome scale metabolic networks, Applications of flux balance analysis, Flux profiles, Robustness through metabolic adjustment, Incorporating gene expression profiles
Introduction
Targeting metabolism in bacteria is an often-used strategy for antibacterial design. Our understanding of the mechanism of action of such drugs is largely centered on the primary target, which it is known to inhibit. For example, it is a well known fact that several antibiotics inhibit bacterial ribosome, thereby preventing protein synthesis required to maintain bacterial population (Kohanski et al. 2010). Not much attention has been paid to the near-concurrent changes that occur (as immediate consequence) upon ribosome inhibition. Conventional approaches of biology do not have the capacity to unravel these elaborate webs of interactions, which is why drug design often fails. Simply knocking out one target molecule in a biochemical pathway, as is often carried out in a target validation exercise is inadequate in explaining the global changes that occur in the cell as well as their functional consequences. This emphasizes the need for systems-based approaches to study such effects. As is the case with systems biology, synthetic biology follows the holistic approach of viewing the system as a whole, and incorporates the insights obtained through systems-based approaches, by taking into account the modularity, predictability and robustness of the system under study. As a prerequisite to the reconstruction of systems such as metabolic networks or even individual biochemical pathways, a thorough understanding of the system as a whole and contribution from its individual modules and their interactions is essential.
Bacterial cells, being inherently robust have several inbuilt mechanisms for overcoming stresses of various kinds (Zuroff et al. 2010). Metabolism, in particular, is based upon a complex network with high inter-connections. The high level of connectivity that exists has been thought to be a basis for generating robustness. There are in fact mechanisms such as feedback inhibition and alternate pathways that have been shown to exist in biological systems (Cinquin and Demongeot 2002). However, these have largely been studied in the vicinity of the primary target itself. The changes elsewhere in the metabolic systems have not been systematically studied. Nevertheless, there are different lines of evidence supporting that changes occur beyond the vicinity of the primary target. These are (a) pharmacological profile or side effects-minor or major of the drug, which cannot be accounted for, by direct interactions of the drug itself with such proteins (Xie et al. 2009), (b) observation of large scale changes in gene expression profile pervading to zones far beyond that of the initial target (Xie et al. 2009; Boshoff et al. 2004; Simon et al. 2004). Although it is widely accepted, that high connectivity exists in the metabolic network, the functional consequences of such high connectivity upon drug exposure or other perturbations have not been understood, nor has the need for such high connectivity become apparent so far. It is also not known whether such interconnections have emerged to cater for a particular goal, if so, what the goal may be or whether they have emerged merely as a consequence of the connections that have come about in the metabolic network. Typically genome-scale networks have thousands of components and several thousands of connections among them, high degrees of the nodes arising due to sharing of components among several reactions and also multiple components required for each reaction (Pfeiffer et al. 2005). With advances in various systems biology techniques, it is now possible to model systems level changes upon inhibiting a chosen target or a metabolic pathway (Raman et al. 2005). A number of techniques have become available now such as kinetic modeling, constraint-based modeling and network analyses, which help us address a variety of questions such as dynamic profile of organism under investigation at various level of hierarchy, temporal response of biological system under the scarcity of available kinetic information and topological connectivity analysis for inferring the information flow and how it could be disrupted or enhanced based on the question being addressed (Chandra 2009). Models constructed through systems-based approaches scaling all the way up to in-silico organisms (Schellenberger et al. 2010), directly provide design strategies for synthetic biology, while the pathways that comprise such models, find ready application in metabolic engineering.
Here we consider isoniazid (INH), a front line antibacterial drug used for the treatment of tuberculosis to understand various metabolic adjustments that could be occurring in the bacterial cell upon exposure to this drug. INH is a prodrug that is recognized by catalase-peroxidase (KatG, Rv1908c) to get converted into an NAD adduct. The adduct then inhibits the InhA protein involved in mycolic acid biosynthesis (Rawat et al. 2003).
Results
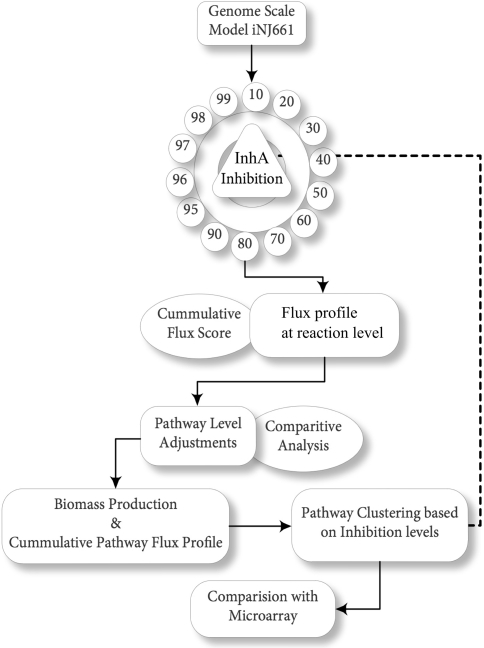
The workflow adopted in this study is as shown in Fig. 1. The genome scale based reconstructed model of Mycobacterium tuberculosis (Mtb) was used for this analysis (Jamshidi and Palsson 2007). The model consists of 661 genes catalyzing 1,028 reactions, associated with a total of 37 pathways and 77% of gene reaction associations. The effect of INH was captured by modifying the fluxes through the reaction of its known target, NADH-dependent enoyl-[acyl-carrier-protein] reductase, InhA (Rv1484). Inhibitions are modeled by pinning the flux values of the corresponding reaction(s) to a percentage of its flux observed in the wild type simulations. Upon drug exposure, it is likely that the target protein’s function is diminished but not completely abolished. It is therefore more realistic to inhibit but not knock-down a target protein in order to study drug effects. In this work, inhibition ranging from 10%, 20%…90%, and then a finer sampling of 95, 96, 97, 98, 99 and 100% extents of inhibition were studied using flux balance analysis. The flux profiles were analysed in terms of the fluxes through different pathways. Each of the 37 pathways that make up the network was then assigned a flux score based on the cumulative flux of all the reactions of that pathway in that simulation. Differences between pathway fluxes of the wild type and the different inhibitions were analysed, from which metabolic adjustments, if any were inferred.
Fig. 1.
Overview of the methodology adopted. Various steps carried out in the current study are depicted in the flowchart
Also, the cumulative flux of all the pathways together at each level of inhibition was assessed with respect to the change in growth of bacterium under various levels of inhibitions of Rv1484. Further, a pathway level clustering analysis was performed in order to elucidate the combination of pathways that were clustered together under the impact of various level of inhibition. Finally the cumulative flux profile of all the pathways under various levels of inhibitions was compared with the published microarray data for INH treatment to infer the correlation between metabolic flux profile and genetic fold change.
Reaction based flux profiles under various levels of inhibition
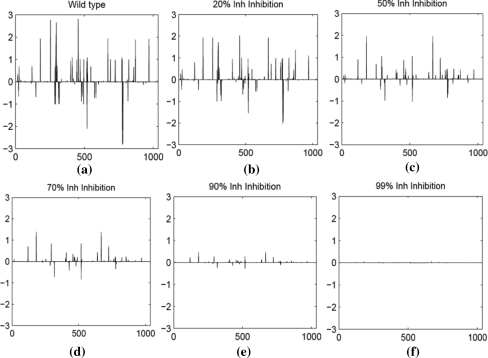
In order to comprehend the possible change in flux upon inhibition of drug target gene Rv1484, a reaction level flux profile for all the reactions involved in the metabolism of Mtb was profiled. Reaction level flux profile in order to understand the metabolic physiology at various levels such as pathway level. The reaction level flux profile within the metabolism of Mtb is as shown in Fig. 2a–f.
Fig. 2.
Reaction level flux profile of Mtb metabolism upon inhibition of Rv1484. a Wild type flux profile. b Flux profile at 20% inhibition. c Flux profile at 50% inhibition. d Flux profile at 70% inhibition. e Flux profile at 90% inhibition and f Flux profile at 99% inhibition. In all the subfigures above, the X-axis represent the number of reactions and Y-axis represent the flux value through each reaction
The drug effects of INH administration were achieved by constraining the flux through the reactions catalyzed by the gene Rv1484. First a list of all the reactions, which involved Rv1484, was prepared from the gene—protein—reaction association. A wild type flux profile was obtained without constraining these reactions where as the inhibition flux profile was obtained by constraining the flux through these reactions to 10, 20, 30, 40, 50, 60, 70, 80, 90, 95, 96, 97, 98, 99 and 100% of their original flux values. With each level of inhibition imposed as a constraint on the system, flux balance analysis was performed to optimize for the maximum growth. A reducing trend in the flux profile with respect to the wild type, yet optimizing for growth, was noted at all the levels of inhibition as shown in Fig. 2.
Figure 2a shows the wild type flux profile of all the reactions. As compared to these, it can be clearly seen that as the inhibition level increases, the flux through several reactions decreases Fig. 2b–f. At the maximum level of inhibition of 100% of this protein, the cell is not capable of producing any biomass, which is reflected in the near zero fluxes of the entire system. The simulation with full inhibition understandably is equivalent to that of gene deletion and in this case indicates that the gene or protein is essential to the cell. Significant changes in the overall flux profiles were noted at 50% (Fig. 2c) inhibition of Rv1484, which further reduced to near zero at 99% inhibition (Fig. 2f). Despite this, the presence of significant flux values for many reactions even at high levels of inhibitions of 70–90% (Fig. 2d, e), indicate that the cell is still capable of some metabolism in it, as compared to the near complete halting at maximum inhibition. However, changes in the profile are observed, which indicates that the metabolic paths to achieve growth under these conditions appear significantly different from that of the wild-type.
Metabolic adjustments inferred at the pathway level
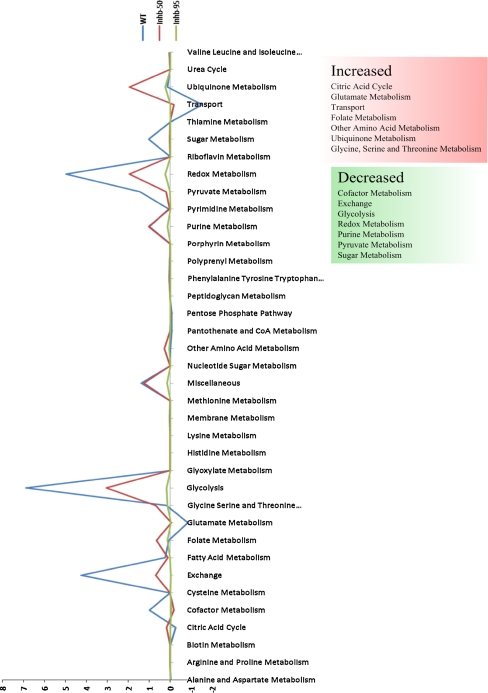
It is well known from a number of cases that metabolites of importance can be produced through alternate pathways even when a key enzyme in a pathway is blocked. Thus, activation or inactivation of certain pathways, which are distant from the target pathway, could be inferred as payoff or adjustments within the metabolism to keep the biological objective operational. The impact on the network upon inhibition of the chosen target has been analysed by considering both a) pathways that were previously inactive, but turned active under the influence of perturbation, b) pathways that were active but turned inactive under the influence of perturbation (Fig. 3).
Fig. 3.
Cumulative flux profiles of all the pathways and the effect on cumulative flux score of the most perturbed pathways upon inhibition of InhA (Rv1484)
The flux score based profile of all the metabolic pathways of Mtb under the influence of 50 and 95% inhibition of Rv1484, with respect to wild type is as shown in Fig. 3. When compared to the wild type flux profile, the pathways that showed a significant increase in their cumulative flux profiles are citric acid cycle, folate metabolism, glutamate metabolism, other amino acid metabolism, transport and ubiquinone metabolism increases, while a significant decrease was observed through the pathways of glycolysis, exchange metabolism, pyruvate metabolism, cofactor metabolism, redox metabolism, sugar metabolism and purine metabolism.
From the results obtained here, an effect on purine metabolism is observed at inhibition levels greater than 50%, wherein, the flux through this pathway gradually reduces. The various studies available in literature indicate that INH affects DNA biosynthesis, while RNA and protein biosynthesis remained unaffected. INH has in fact been shown to suppress nucleic acid biosynthesis through isotope investigation studies on the effect of INH on macromolecule biosynthesis in cultures of BCG (Phipps) strain of Mtb (Argyrou et al. 2006). This ‘unbalanced growth’ can be lethal to the organism, and the nature of the lethal event is yet to be deduced. Redox metabolism and ubiquinone metabolism pathways are among the highly influenced pathways upon InhA inhibition to various levels. Our previous study using network topology alone, also suggested that a strong correlation exists between redox metabolism and ubiquinone metabolism (Raman et al. 2009). Ubiquinone metabolism is highly interconnected to citric acid cycle and cofactor metabolism. Redox metabolism is also highly interconnected to these pathways. Thus, a complex cascading effect is seen in the flux profiles of these pathways though the target fatty acid biosynthesis pathway appears to be functionally distant from these, as judged from the metabolic network.
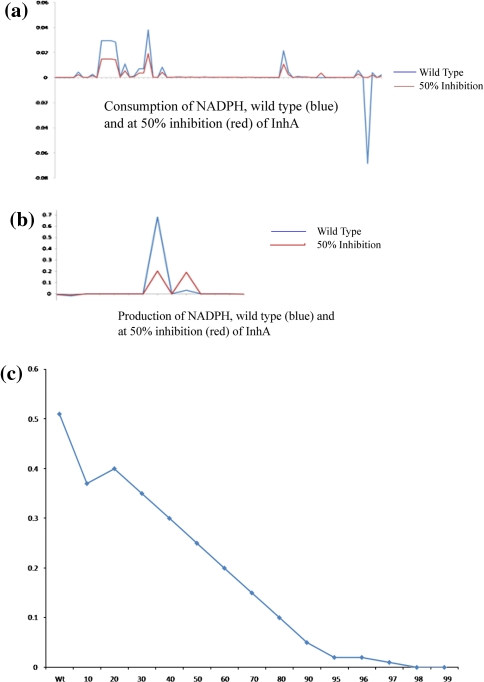
Earlier reports based on biochemical analysis indicate that INH leads to depletion of NADH and NADPH pools and that such depletion leads to bactericidal activity (Awaness and Mitchison 1973). NAD(P)H is an essential cofactor in oxidative pathways. It is also involved in the reaction catalyzed by InhA. We examined the fluxes of the reaction both producing and consuming NAD(P)H. The difference in fluxes, between the wild type and 50% inhibition, shown in Fig. 4, indeed indicate that there is a drastic reduction in the cofactor pools. The effect of the drug is thus not only to inhibit the pathway it was intended to, but is also in terms of depleting the co-factor pools in the cell. Adjustment to overcome this can be seen at 20% of inhibition where the production of NADPH increases. A general observation is that adjustments of this type are often seen at lower extents of inhibition, presumably when the cell is still able to overcome the drug stress. Profiles for other important metabolites have also been analysed, which indicate a general decrease in the levels of Acetyl-CoA, d-Alanine, S-Adenosyl-l-methionine, whereas a notable increase was observed in case of Arachidic-acid, l-Arginine, l-Asparagine metabolites. The detailed list of all the increased and decreased metabolites pool is given in Online Resource 1.
Fig. 4.
Flux profile of NADPH a The flux profile of reactions involved in the consumption of NADPH. b The flux profile of reactions involved in the production of NADPH. In both a and b the X-axis represents the individual reactions and Y-axis represents the total flux value, the blue and red lines represent the flux values at wild type and at 50% inhibition of InhA, respectively. The change in total NADPH pool (Σ(b)−Σ(a)) is shown in (c) for different levels of inhibition with INH
Among the metabolites that show an increase in their corresponding pathway or reaction fluxes, that of fatty acid intermediates is of special interest to INH action. The fluxes show a general increase (Online Resource 1). An intracellular accumulation of fatty acids was also observed. It has been reported earlier that the induction of kasA (Rv2245) and acpM (Rv2244) could be a consequence of a regulatory feedback mechanism that senses the imbalance of mycolic acid biosynthetic intermediates.
With the exception of glutamate, glycine, serine and threonine metabolism, and other amino acid metabolism, which show significant variation upon InhA inhibition, the remaining pathways involved in protein synthesis show little variation in terms of their cumulative flux values. Literature evidence points to the fact that total protein synthesis remains unaffected during INH exposure (Takayama et al. 1972; Gangadharam et al. 1963). This can be observed in the cumulative pathway profile.
Effect of InhA inhibition on Mtb biomass
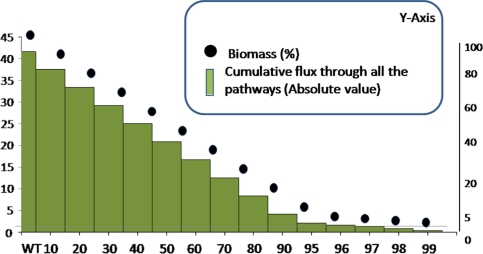
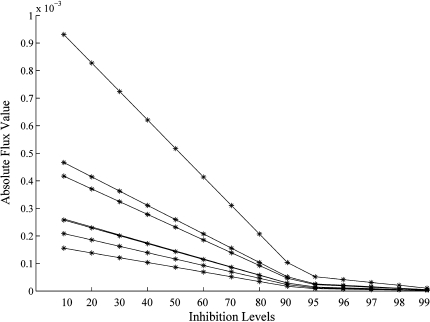
Figure 5 shows the effect of InhA inhibition on the biomass of Mtb. As can be expected, the biomass gradually decreases as the level of inhibition increases. The reducing effect in the biomass, as obtained using flux balance approach were well matched with the published in vitro report wherein the cells exposed to 0.5 μg of INH/ml gradually lose their ability to synthesize mycolic acids (Takayama et al. 1972) and there is a decrease in the number of viable cells. Figure 6 shows that the flux through the reactions involved in mycolic acid biosynthesis decreases with increase in InhA inhibition levels, similar to the effect of INH concentration on mycolic acid biosynthesis reported by Takayama and co-workers. Other studies show that mycolic acid biosynthesis is inhibited to 78%, which implies that only 22% of biomass is produced in these conditions (Awaness and Mitchison 1973). In this study, such a reduction is indeed observed with only 22% of the biomass being produced when the extent of inhibition is about 98%.
Fig. 5.
A plot showing biomass production (dots) and cumulative flux through all the pathways together (bars) upon various levels of inhibition of InhA (% inhibition indicated in the X-axis). The Y-axis (shown in the left) indicates extent of biomass produced (in %) under different inhibitor concentrations. The corresponding cumulative fluxes through all pathways are plotted in an absolute scale (shown in the right). At 0% inhibition, the biomass produced is considered to be 100%
Fig. 6.
Reduction in fluxes of reactions involved in mycolic acid biosynthesis. The Y-axis represents the absolute flux value, while the X-axis represents the inhibition levels. The simulations reported here are in agreement with that reported by an earlier experimental study (Takayama et al. 1972)
Figure 5 also shows the effect of INH on all the pathways at different inhibition levels of InhA. This plot follows the same trend as the biomass curve. Glycolysis, ubiquinone metabolism and redox metabolism have the maximum influence. A similar trend is observed in microarray experiments which show that the genes belonging to the TubercuList functional class of ‘intermediary metabolism and respiration’ are the ones that are highly regulated, along with the genes belonging to the ‘conserved hypotheticals’ functional class (Betts et al. 2003).
Pathway level clustering
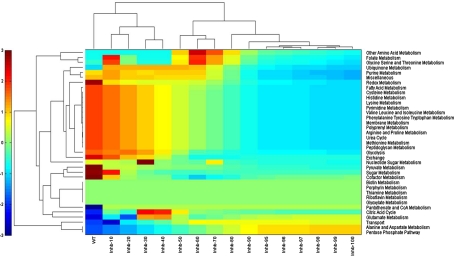
The metabolic pathways were also clustered based on their flux scores under the influence of various levels of inhibition of InhA (Fig. 7). City Block based metric was used for the clustering of the pathways (Krause 1987). The objective behind pathway based clustering was to identify correlations among pathways based on similarity in their flux profiles. Pathways such as folate metabolism, glycine, serine and threonine metabolism and ubiquinone metabolism along with other amino acid metabolism showed activation with respect to their cumulative flux values at wild type condition when InhA was inhibited to 50–60%. A constant trend in the reduction of cumulative flux can be seen in glycolysis pathway which decreases subsequently upon each level of inhibition of InhA.
Fig. 7.
Clustering of the pathways based on their cumulative flux profiles under the influence of various levels of inhibition of InhA, using city block metric. The pathways are listed on the right. The pathways that share the highest similarity in their profiles with any other pathway in the set will be plotted together, the cluster of activated pathways plotted at the top, while the inactivated pathways are seen to be clustered together. Colours are indicative of the absolute cumulative score of the individual pathways, red indicative of positive fluxes as compared to wild type (and hence those of activated pathways), while blue indicates reduction in fluxes as compared to those of the wild type and hence correspond to inactivated pathways. Green on the other hand, indicated fluxes that remain at 0 or close to zero. The clustering of colours through the spectrum is evident. (Color figure online)
Such examples of metabolic adjustments clearly depicts that the pathways which were inactive under wild type conditions became active, for maintaining the growth of bacterium. The increase in the fluxes through some other pathways such as other amino acid metabolism can be correlated with the availability of alternate routes within in the metabolism that could be used by the bacterium to achieve growth upon drug stress. It therefore becomes important to consider these aspects in the target identification stage itself.
Comparison of flux profiles with gene expression profiles
The cumulative flux profiles at pathway level were compared with the existing gene expression data of Mtb when exposed to INH at various conditions. Boshoff et al. performed transcriptional profiling of Mtb to measure the effects of different drugs, drug combinations or different growth conditions at various times (Boshoff et al. 2004). For a comparison with the flux profiles upon InhA inhibition, the expression data for INH exposure available from literature was considered (0.4 μg/ml concentration for 6 h).
From the fold changes in expression for the individual genes, a cumulative pathway expression score was computed, by considering the annotated gene-protein-reaction-pathway associations through appropriate Boolean relation of these genes in their respective reactions. This score was then compared with the cumulative flux scores of each pathway at all levels of inhibition (Online Resource 2).
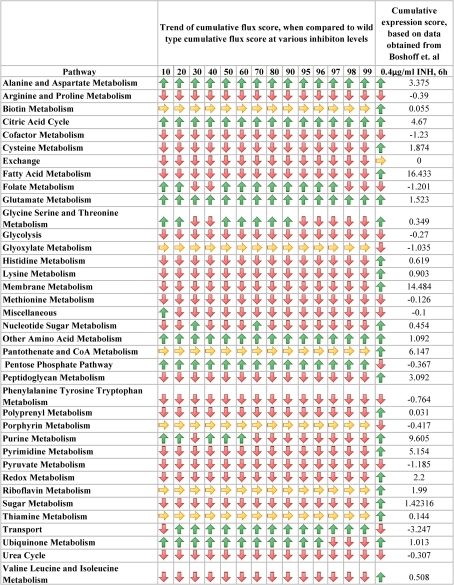
Out of the 37 pathways present in the model, biotin metabolism, glyoxylate metabolism, pantothenate and CoA metabolism, porphyrin metabolism, riboflavin metabolism and thiamine metabolism were not considered for comparison, since the reactions involved in these pathways did not yield any net flux, under the simulation conditions. When compared with the cumulative flux profiles, it was observed that the cumulative flux of the individual pathways correlated with the gene expression profile of INH exposure at 0.4 μg/mL concentration in about 12 of the 30 pathways considered. In these pathways, it was observed that the cumulative flux at various inhibition levels of InhA gradually increased or decreased with respect to the wild type flux profile, agreeing in many cases with the overall trend reported through microarray experiments (Fig. 8).
Fig. 8.
Comparison of flux profiles with gene expression profile. The upward arrow indicates increase in flux or expression profile, downward arrow indicates decrease and horizontal arrow indicate no change. The last column gives the cumulative expression score of each pathway at 6 h exposure of 0.4 μg/ml of INH (Boshoff et al. 2004)
For example, alanine and aspartate metabolism, citric acid cycle, glutamate metabolism and ubiquinone metabolism show increasing net fluxes. Their gene expression profiles also indicate up-regulation upon exposure to INH. Similarly, arginine and proline metabolism, cofactor metabolism, glycolysis, methionine metabolism and pyruvate metabolism show decreasing net fluxes and their gene expression profiles indicate down-regulation.
Discussion
The remarkable capability of bacteria to swiftly adapt to their environments, thus making them robust to a variety of conditions is well known. It is quite logical to expect that the bacterium will try to utilize its robustness mechanisms to overcome the stress caused due to drug exposure as well. Systems, when viewed as a whole, have sufficient information to study phenomena such as self correction and robustness, enabling addressing questions such as whether bacteria try to survive the onslaught of antibiotic drugs administered against it and if so how. Here we seek to address the question of various metabolic adjustments that could take place to overcome the effect of the drug, even if it is to a small extent. We seek to address the question of “metabolic adjustment” by mimicking the effect of the first line drug for tuberculosis, INH, on its metabolism using flux balance approach.
Owing to the connectivity and existence of alternate paths in the metabolic network, the metabolic adjustment could be defined as a distant effect within the metabolic network with respect to the perturbed pathway or reaction. Being equipped with various feed-forward and feed-backward loops within the metabolic network, it is quite logical that perturbation at certain points within the network could lead to activation or de-activation of other channels within the network to counter or enhance the effect of perturbation. Metabolic adjustments, thus captures such changes within the metabolic network, which arises due to certain perturbations to the network.
Given the high inter-connectivity among reactions in the metabolic network, several types of changes could be possible to overcome the drug stress, especially at lower doses of the drug and hence at lower extents of inhibition of the chosen target. The variations observed in the fluxes of the individual pathways in our simulations are indeed reflective of this theme. Examination of the flux profiles at the pathway level, indicate that several pathways understandably show a reduction in their cumulative flux. Surprisingly however, a few pathways show an overall increase in their pathway fluxes. Not only that, the trend is seen to vary in about four pathways, particularly connected with nucleic acid metabolism, across different extents of inhibition.
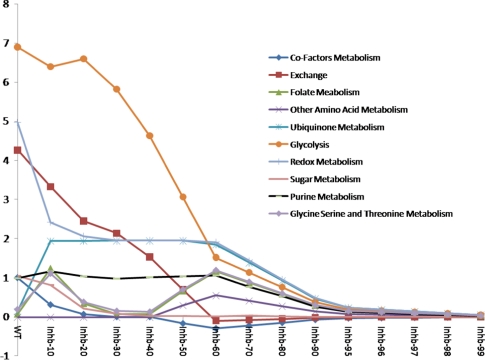
As shown in Fig. 9, it is interesting to notice that most of the variations in the pathways occur at 10 and 60% inhibition of InhA. The flux score of pathways such as folate metabolism, glycine, serine, threonine metabolism and ubiquinone metabolism increases at 10% inhibition of InhA which subsequently decreases on the further inhibition but abruptly increases at 50% inhibition of InhA (in case of folate metabolism and glycine, serine and threonine metabolism) and approaches zero on further inhibition. The observations here demonstrate that the behavior of the system is a result of several interactions among its constituents.
Fig. 9.
Flux profiles of the indicated pathways at various levels of InhA inhibition. The absolute values of the cumulative fluxes of the pathway are indicated in the Y-axis
In the pathways shown in Fig. 9, none of them include Fatty acid metabolism, the prime target of INH. Hence these pathways can be distantly related to fatty acid metabolism as they were found to be most perturbed upon inhibition of InhA.
Folate dependent single-carbons play an important role in amino acid metabolism, nucleic acid biosynthesis and membrane lipid synthesis. Tetrahydrofolate can accept methyl groups from serine and glycine, and the resultant product is a central compound in 1-carbon metabolism. While the flux score of the redox metabolism drops at 10% inhibition of InhA, it is observed that both the redox metabolism and ubiquinone metabolism follow a similar pattern from thereon. The flux score associated with these pathways almost remains constant till 60% inhibition. The effect of inhibition of InhA can be observed in other amino acid metabolism in the inhibition range of 50–90%. The flux score of a pathway can also be considered as the amount of activity within the pathway. Based on Fig. 9 it can be noticed that most of the pathways such as glycolysis, ubiquinone metabolism, redox metabolism, folate metabolism, glycine, serine and threonine metabolism, purine metabolism, and other amino acid metabolism are active till 60% inhibition of InhA but then tends to become inactive upon further inhibition.
Information in biological systems traverses through various levels in the biological hierarchy, starting from the genome level, to the transcriptome, proteome and metabolome levels. Various studies have been carried out by coupling data across the levels to infer the relationship between the genotype and phenotype. On similar lines, the present study compares gene expression data and metabolic fluxes, in the context of metabolic adjustments upon drug exposure. Comparison with the gene expression profiles indicate that there is general agreement in 4 of the 6 pathways that have activated, while correlation is lower in case of inactivated pathways, with agreement in only 8 of the 20 pathways compared.
The fold expression of a particular gene in the microarray expression data can be related to its functional presence in the system, such as metabolic pathways. Following the central dogma the fold expression values of genes can be correlated with the amount of protein present in the system, which further can be related to the activity of the reaction it catalyzes. The probable reason for disagreement between microarray expression value and flux score for a given pathway could be due to the intrinsic systems properties such as feedback inhibition which leads to low production of metabolites (Goyal et al. 2010). Fatty acid metabolism, membrane metabolism and peptidoglycan metabolism are closely related owing to their association with cell wall biosynthesis. Microarray experiments show up-regulation of the genes involved in these pathways to a great extent. Considering that the mycobacterial cell wall is an integral component for survival and pathogenesis, and INH specifically targets its biosynthesis, the genes get up-regulated to counteract the effect of INH. This increase in the expression could explain the presence of fatty acid metabolism, membrane metabolism and peptidoglycan metabolism, as observed by the flux through these pathways even at high inhibition levels. Although the flux through these pathways progressively decreases, there is an attempt by the pathogen to keep the metabolic machinery running even at high inhibition levels. The decrease in the flux is also influenced by the decrease in the metabolite levels upon drug exposure. As seen in the present study, there is a decrease in the NAD(P)H metabolite level. The metabolic flux profile of redox metabolism pathway shows a decreasing trend, which could result in the decrease in the production of NAD(P)H. Although the gene expression data can be compared with the flux profile at the reaction level to a certain extent, it does not provide a systems view required to analyse models of such nature.
At the least, the dynamic modulation observed in the simulations serves to theoretically suggest the possibility of modification of fluxes both positively and negatively in order to attempt maintenance of metabolism. The fact that an increase is observed in the reaction fluxes by itself is strongly suggestive of some type of an adjustment or robustness phenomenon. Newer experiments could be designed to test the hypotheses of which pathways are amenable to modification and when and more importantly the consequences of perturbation at any point in the network on the metabolism as a whole. Targeting such pathways along with actual pathways could thus serve as suitable candidate for optimal drug target discovery. A more profound understanding of drug administration and its effect is possible by using a systems level approach. This paradigm shift towards systems based approaches is useful in generating hypotheses in identifying better drug targets, both individually and in combination, and for the design of low-dose, specific drugs.
Methods
The metabolic network
Genome-scale constraints based reconstruction of Mtb metabolic network has been reported by Jamshidi and Palsson. The model, iNJ661 consist of 661 genes, 543 proteins, 828 metabolites and 1,028 reactions (Jamshidi and Palsson 2007).
Flux balance analysis and modeling enzyme inhibition
Using this model we have performed metabolic flux balance and inhibition studies. Flux balance analysis (FBA), uses linear optimization to determine the steady-state reaction flux distribution in a metabolic network by maximizing an objective function, such as ATP production or growth rate. FBA involves carrying out a steady state analysis, using the stoichiometric matrix for the system in question. An important assumption is that the cell performs optimally with respect to a metabolic function, such as maximization of biomass production or minimization of nutrient utilization. The dynamic mass balance of the metabolic system is described using the stoichiometric matrix Sm × n, relating the flux rates of enzymatic reactions, vn × 1 to time derivatives of metabolite concentrations, xm × 1 as dx/dt = S.v where v = [v1, v2 … vni b1 b2 … bnext]T;vi signifies the internal fluxes, bi represents the exchange fluxes in the system, ni is the number of internal metabolites and next is the number of external metabolites in the system. At steady state, dx/dt = S.v = 0. Therefore, the required flux distribution belongs to the null space of S. Since there are many more reactions than metabolites (n > m), the system is under-determined (with n–m degrees of freedom), necessitating the imposition of additional constraints to obtain meaningful solutions of steady state flux distributions. To solve the under-determined system, additional flux constraints can be imposed through the measurement of certain fluxes. More commonly, additional constraints are imposed by defining lower and upper bound for the fluxes. For example, the lower and upper bounds of the fluxes can be constrained as follows:
 |
which necessitates all internal irreversible reactions to have a flux in the positive direction and allows exchange fluxes to be in either direction. This enables the formulation of the under-determined system as an optimization problem. The next critical step is to define an objective function that captures the biochemical goal of the system itself. A linear objective function results in a linear programming (LP) problem:
 |
where c represents the objective function composition, in terms of the fluxes. COBRA toolbox (Becker et al. 2007) implemented in MATLAB version R2007a was used for all the FBA calculations (Mathworks http://www.mathworks.com/).
Clustering
The city block metric based clustering was applied (Krause 1987). Given an m‐by‐n data matrix X, the matrix is treated as m (1‐by‐n) row vectors x1, x2…xm, the city block distance between vector Xr and Xs is given as follows:
 |
Where drs is the distance between two vectors Xrand Xs. MATLAB was used for all the calculations.
Electronic supplementary material
Below is the link to the electronic supplementary material.
Acknowledgments
We thank the Department of Biotechnology (DBT), Government of India and Open Source Drug Discovery program (CSIR) for financial support. The use of facilities at the Bioinformatics Centre, Indian Institute of Science is also gratefully acknowledged.
Abbreviations
- INH
Isoniazid
- Mtb
Mycobacterium tuberculosis
- InhA
NADH-dependent enoyl [acyl-carrier-protein] reductase
- NAD(P)
Nicotinamide adenine dinucleotide (phosphate)
Footnotes
Ashwini G. Bhat and Rohit Vashisht contributed equally to this work.
References
- Argyrou A, Jin L, Siconilfi-Baez L, Angeletti RH, Blanchard JS. Proteome-wide profiling of isoniazid targets in mycobacterium tuberculosis. Biochemistry. 2006;45(47):13947–13953. doi: 10.1021/bi061874m. [DOI] [PMC free article] [PubMed] [Google Scholar]
- Awaness AM, Mitchison DA. Cumulative effects of pulsed exposures of mycobacterium tuberculosis to isoniazid. Tubercle. 1973;54(2):153–158. doi: 10.1016/0041-3879(73)90035-4. [DOI] [PubMed] [Google Scholar]
- Becker SA, Feist AM, Mo ML, Hannum G, Palsson BO, Herrgard MJ. Quantitative prediction of cellular metabolism with constraint-based models: the cobra toolbox. Nat Protocols. 2007;2(3):727–738. doi: 10.1038/nprot.2007.99. [DOI] [PubMed] [Google Scholar]
- Betts JC, McLaren A, Lennon MG, Kelly FM, Lukey PT, Blakemore SJ, Duncan K. Signature gene expression profiles discriminate between isoniazid-, thiolactomycin-, and triclosan-treated mycobacterium tuberculosis. Antimicrob Agents Chemother. 2003;47(9):2903–2913. doi: 10.1128/AAC.47.9.2903-2913.2003. [DOI] [PMC free article] [PubMed] [Google Scholar]
- Boshoff HI, Myers TG, Copp BR, McNeil MR, Wilson MA, Barry CE., 3rd The transcriptional responses of mycobacterium tuberculosis to inhibitors of metabolism: Novel insights into drug mechanisms of action. J Biol Chem. 2004;279(38):40174–40184. doi: 10.1074/jbc.M406796200. [DOI] [PubMed] [Google Scholar]
- Chandra N. Computational systems approach for drug target discovery. Expert Opinion Drug Discov. 2009;4(12):1221–1236. doi: 10.1517/17460440903380422. [DOI] [PubMed] [Google Scholar]
- Cinquin O, Demongeot J. Roles of positive and negative feedback in biological systems. Comptes Rendus Biologies. 2002;325(11):1085–1095. doi: 10.1016/S1631-0691(02)01533-0. [DOI] [PubMed] [Google Scholar]
- Gangadharam PR, Harold FM, Schaefer WB. Selective inhibition of nucleic acid synthesis in mycobacterium tuberculosis by isoniazid. Nature. 1963;198:712–714. doi: 10.1038/198712b0. [DOI] [PubMed] [Google Scholar]
- Goyal S, Yuan J, Chen T, Rabinowitz JD, Wingreen NS. Achieving optimal growth through product feedback inhibition in metabolism. PLoS Comput Biol. 2010;6(6):e1000802. doi: 10.1371/journal.pcbi.1000802. [DOI] [PMC free article] [PubMed] [Google Scholar]
- Jamshidi N, Palsson B. Investigating the metabolic capabilities of mycobacterium tuberculosis H37Rv using the in-silico strain iNJ661 and proposing alternative drug targets. BMC Systems Biol. 2007;1(1):26. doi: 10.1186/1752-0509-1-26. [DOI] [PMC free article] [PubMed] [Google Scholar]
- Kohanski MA, Dwyer DJ, Collins JJ. How antibiotics kill bacteria: from targets to networks. Nat Rev Micro. 2010;8(6):423–435. doi: 10.1038/nrmicro2333. [DOI] [PMC free article] [PubMed] [Google Scholar]
- Krause EF (1987) Taxicab geometry: an adventure in non-euclidean geometry. Mineola, NY: Dover
- Pfeiffer T, Soyer OS, Bonhoeffer S. The evolution of connectivity in metabolic networks. PLoS Biol. 2005;3(7):e228. doi: 10.1371/journal.pbio.0030228. [DOI] [PMC free article] [PubMed] [Google Scholar]
- Raman K, Rajagopalan P, Chandra N. Flux balance analysis of mycolic acid pathway: targets for anti-tubercular drugs. PLoS Comput Biol. 2005;1(5):e46. doi: 10.1371/journal.pcbi.0010046. [DOI] [PMC free article] [PubMed] [Google Scholar]
- Raman K, Vashisht R, Chandra N. Strategies for efficient disruption of metabolism in Mycobacterium tuberculosis from network analysis. Molecular BioSystems. 2009;5(12):1740–1751. doi: 10.1039/b905817f. [DOI] [PubMed] [Google Scholar]
- Rawat R, Whitty A, Tonge PJ. The isoniazid-nad adduct is a slow, tight-binding inhibitor of inha, the mycobacterium tuberculosis enoyl reductase: adduct affinity and drug resistance. Proc Natl Acad Sci USA. 2003;100(24):13881–13886. doi: 10.1073/pnas.2235848100. [DOI] [PMC free article] [PubMed] [Google Scholar]
- Schellenberger J, Park J, Conrad T, Palsson B. BiGG: A biochemical genetic and genomic knowledgebase of large scale metabolic reconstructions. BMC Bioinformatics. 2010;11(1):213. doi: 10.1186/1471-2105-11-213. [DOI] [PMC free article] [PubMed] [Google Scholar]
- Simon JW, Richard AS, Ken L, Laurent K, Robert CR, Robert CR, Gurdyal SB. The use of microarray analysis to determine the gene expression profiles of mycobacterium tuberculosis in response to anti-bacterial compounds. Tuberculosis (Edinburgh, Scotland) 2004;84(3):263–274. doi: 10.1016/j.tube.2003.12.005. [DOI] [PMC free article] [PubMed] [Google Scholar]
- Takayama K, Wang L, David HL. Effect of isoniazid on the in vivo mycolic acid synthesis, cell growth, and viability of mycobacterium tuberculosis. Antimicrob Agents Chemother. 1972;2(1):29–35. doi: 10.1128/aac.2.1.29. [DOI] [PMC free article] [PubMed] [Google Scholar]
- Xie L, Li J, Xie L, Bourne PE. Drug discovery using chemical systems biology: identification of the protein-ligand binding network to explain the side effects of CETP inhibitors. PLoS Comput Biol. 2009;5(5):e1000387. doi: 10.1371/journal.pcbi.1000387. [DOI] [PMC free article] [PubMed] [Google Scholar]
- Zuroff T, Bernstein H, Lloyd-Randolfi J, Jimenez-Taracido L, Stewart P, Carlson R. Robustness analysis of culturing perturbations on escherichia coli colony biofilm beta-lactam and aminoglycoside antibiotic tolerance. BMC Microbiol. 2010;10(1):185. doi: 10.1186/1471-2180-10-185. [DOI] [PMC free article] [PubMed] [Google Scholar]
Associated Data
This section collects any data citations, data availability statements, or supplementary materials included in this article.
Supplementary Materials
Below is the link to the electronic supplementary material.


