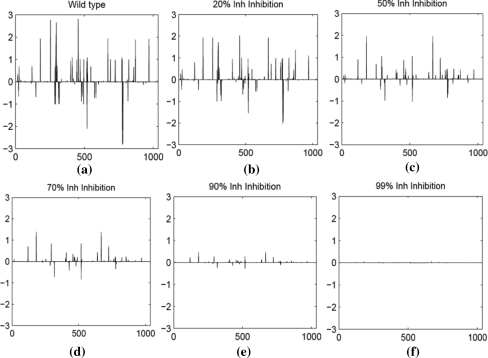
Fig. 2.
Reaction level flux profile of Mtb metabolism upon inhibition of Rv1484. a Wild type flux profile. b Flux profile at 20% inhibition. c Flux profile at 50% inhibition. d Flux profile at 70% inhibition. e Flux profile at 90% inhibition and f Flux profile at 99% inhibition. In all the subfigures above, the X-axis represent the number of reactions and Y-axis represent the flux value through each reaction

