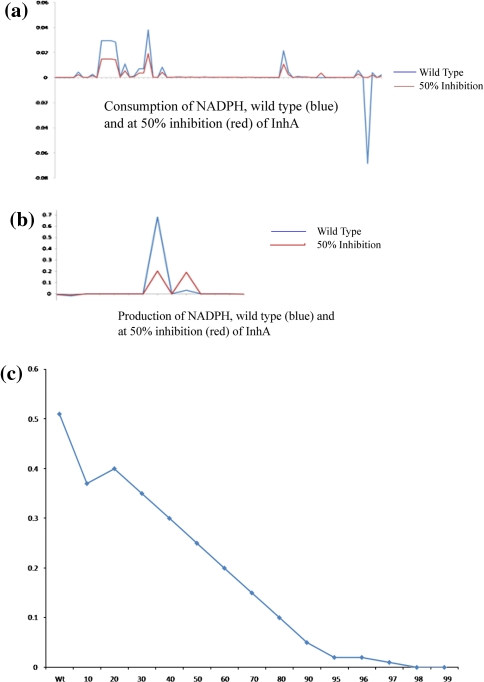
Fig. 4.
Flux profile of NADPH a The flux profile of reactions involved in the consumption of NADPH. b The flux profile of reactions involved in the production of NADPH. In both a and b the X-axis represents the individual reactions and Y-axis represents the total flux value, the blue and red lines represent the flux values at wild type and at 50% inhibition of InhA, respectively. The change in total NADPH pool (Σ(b)−Σ(a)) is shown in (c) for different levels of inhibition with INH

