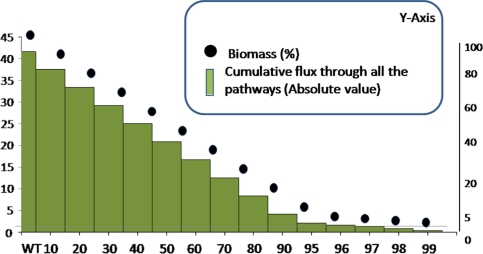
Fig. 5.
A plot showing biomass production (dots) and cumulative flux through all the pathways together (bars) upon various levels of inhibition of InhA (% inhibition indicated in the X-axis). The Y-axis (shown in the left) indicates extent of biomass produced (in %) under different inhibitor concentrations. The corresponding cumulative fluxes through all pathways are plotted in an absolute scale (shown in the right). At 0% inhibition, the biomass produced is considered to be 100%

