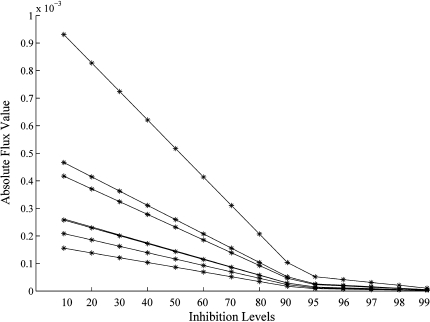
Fig. 6.
Reduction in fluxes of reactions involved in mycolic acid biosynthesis. The Y-axis represents the absolute flux value, while the X-axis represents the inhibition levels. The simulations reported here are in agreement with that reported by an earlier experimental study (Takayama et al. 1972)

