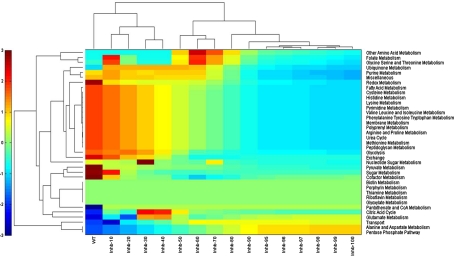
Fig. 7.
Clustering of the pathways based on their cumulative flux profiles under the influence of various levels of inhibition of InhA, using city block metric. The pathways are listed on the right. The pathways that share the highest similarity in their profiles with any other pathway in the set will be plotted together, the cluster of activated pathways plotted at the top, while the inactivated pathways are seen to be clustered together. Colours are indicative of the absolute cumulative score of the individual pathways, red indicative of positive fluxes as compared to wild type (and hence those of activated pathways), while blue indicates reduction in fluxes as compared to those of the wild type and hence correspond to inactivated pathways. Green on the other hand, indicated fluxes that remain at 0 or close to zero. The clustering of colours through the spectrum is evident. (Color figure online)

