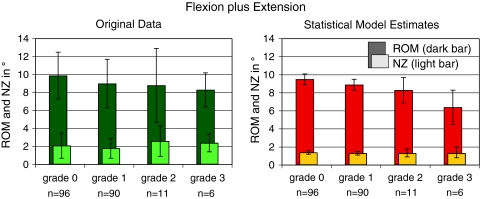
Fig. 2.
Range of motion (ROM, dark bar) and neutral zone (NZ, light bar) in flexion plus extension with respect to the degree of degeneration. Left original data before application of the statistical model (mean and standard deviation, all levels from L1–L2 to L4–L5 were pooled together); right estimates of the statistical model (mean and confidence intervals). n number of segments per degree of degeneration

