
Figure 1.
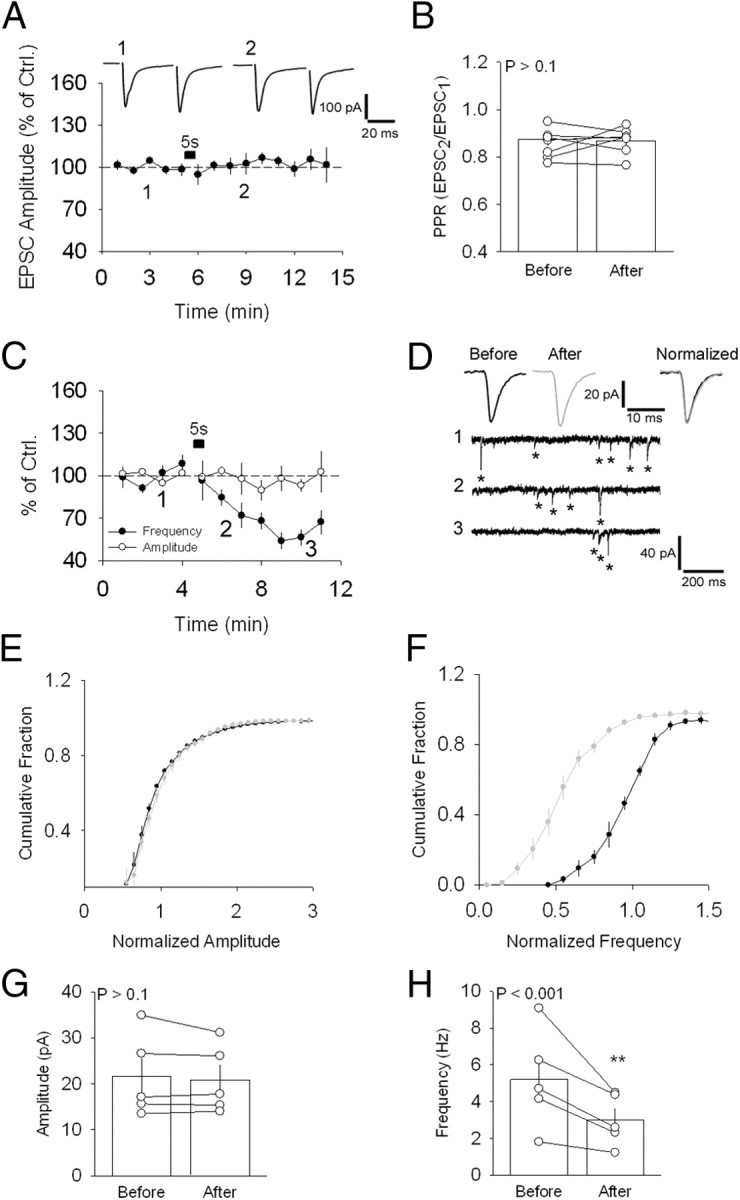
Depolarization-induced suppression of spontaneous release. A, Absence of effect of a 5 s depolarizing step (−60–0 mV) on evoked synaptic responses at the CSh–EX synapse. Sample traces are shown above. B, PPR values for the neurons shown in A. C, Average effect of the same depolarizing step on mEPSC frequency and amplitude in the presence of TTX. D, Sample traces showing a reduction in frequency of mEPSCs before (1) and following (2, 3) the current step. Sample average mEPSCs are shown above, separately (left and middle), and normalized and superimposed (right). Asterisks indicate the mEPSCs detected by the analysis software. E, Average cumulative distribution of the amplitude of mEPSCs recorded before (black circles) and after (gray circles) DSSR induction for the neurons in C. F, Same as in E for mEPSC frequency. G, Average mEPSC amplitude for the neurons in C before and after DSSR induction. H, Same as G for mEPSC frequency. **p < 0.01. Error bars indicate SEM and example traces are averages of 30–40 singles traces. Ctrl., Control.