Figure 1.
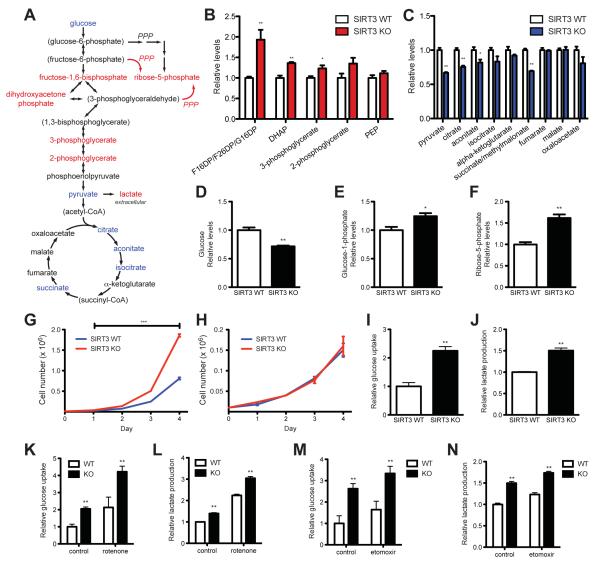
Metabolic profiles of SIRT3 KO MEFs reflect an increase in glycolytic pathways and a decrease in mitochondrial oxidative metabolism. (A) Schematic illustrating the metabolites that are increased (red) or decreased (blue) in SIRT3 KO MEFs compared to SIRT3 WT MEFs (n = 4), p < 0.1. Metabolites in parentheses were not measured. PPP, pentose phosphate pathway. The nonoxidative (red) and oxidative (black) arms of the PPP are shown. Levels of glycolytic intermediates (B), TCA cycle intermediates (C), glucose (D), glucose-1-phosphate (E) and ribose-5-phosphate (F). Growth curves of SIRT3 WT and KO MEFs (n = 3) cultured in media containing glucose (G) or galactose (H). Error bars, ±SD. (I-N) Glucose uptake and lactate production in SIRT3 WT and KO MEFs (n = 6). (I) Relative glucose uptake and (J) lactate production in SIRT3 WT and KO MEFs. (K) Relative glucose uptake and (L) relative lactate production in SIRT3 WT and KO MEFs incubated with or without 100 nM rotenone. (M) Glucose uptake and (N) lactate production in SIRT3 WT and KO MEFs cultured in the presence or absence of 50 μg/ml etomoxir. Cells were treated with drugs for 24 hours before measuring glucose uptake and lactate. All error bars (except growth curves), ±SEM. (*) p < 0.05; (**) p < 0.01, (***) p < 0.001. See also Figure S1.

