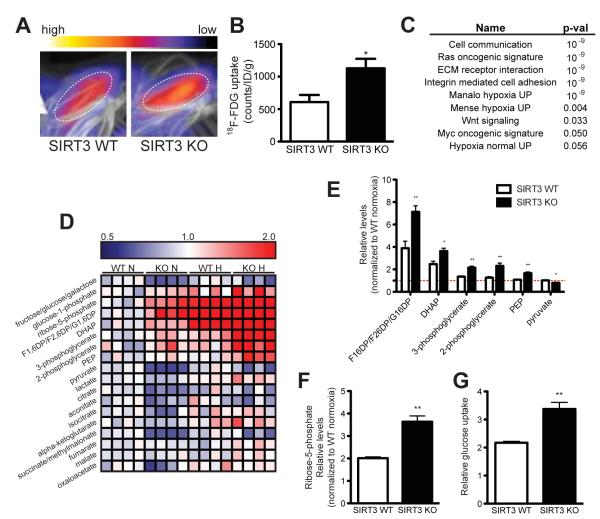
Figure 2.
SIRT3 KO mice have elevated glucose uptake and hypoxic signatures in vivo. 18F-fluorodeoxyglucose (18F-FDG) uptake in the brown adipose tissue (BAT) of SIRT3 WT and KO mice was measured using positron emission tomography-computed tomography (PET/CT). (A) Representative scans with color scale bar indicating relative levels of uptake from low (black) to high (white). (B) Quantification of BAT 18F-FDG uptake normalized to body weight (n = 6). (C) Gene set enrichment analysis of canonical pathways with the ranked genes list from most up- to most down-regulated in SIRT3 KO BAT. (D) Heat map comparing metabolite patterns of SIRT3 deletion and hypoxia. Red and blue indicate up- or down-regulation, respectively. SIRT3 WT and KO MEFs (n = 4) were cultured in 21% O2 (normoxia, N) or 1% O2 for 12 hours (hypoxia, H) and metabolites were analyzed by LC-MS. Relative levels of glycolytic intermediates (E) and ribose-5-phosphate (F). (G) Glucose uptake of MEFs cultured under hypoxia for 6 hours. Error bars, ±SEM. (*) p < 0.05; (**) p < 0.01. See also Figure S2.

