Figure 3.
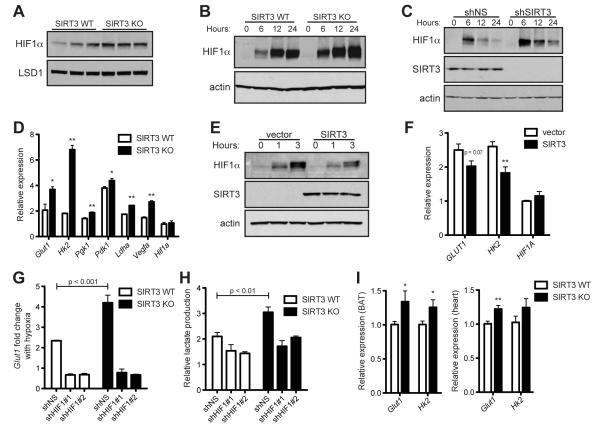
SIRT3 regulates HIF1α stability. (A) Immunoblots of nuclear extracts from SIRT3 WT and KO MEFs cultured at 21% O2. Immunoblots of MEFs (B) or HEK293T cells expressing control shRNA (shNS) or shRNA targeted against SIRT3 (C) cultured at 1% O2 for the indicated times. (D) HIF1α target genes in SIRT3 WT and KO MEFs after 6 hours of hypoxia were measured by qRT-PCR and shown as a ratio of SIRT3 WT normoxia levels. (E) Immunoblots of HEK293T cells stably overexpressing empty vector or SIRT3 cultured at 1% O2 for the indicated times. (F) Expression of HIF1α target genes in HEK293T control and SIRT3-overexpressing cells after 6 hours of hypoxia. (G) SIRT3 WT and KO MEFs expressing shNS or shRNA against HIF1α (shHIF1#1,2) were cultured in normoxia or hypoxia (6 hours) and the fold change in Glut1 levels was measured by qRT-PCR. (H) Lactate produced by SIRT3 WT and KO MEFs expressing shNS or shHIF1α after 6 hours of hypoxia expressed as a ratio of SIRT3 WT shNS normoxic controls. Significance was assessed by two-way ANOVA. (I) Expression of Glut1 and Hk2 in the brown adipose tissue (left) and heart (right) of SIRT3 WT and KO mice (n =5-7) was measured by qRT-PCR. β-2-microglobulin or Rps16 were used as endogenous controls for qRT-PCR. Error bars, ±SEM (n = 4-6). (*) p <0.05; (**) p <0.01. See also Figure S3.

