Figure 4.
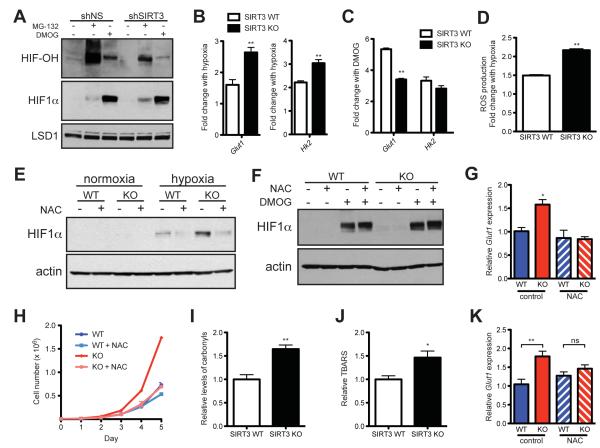
SIRT3 regulates HIF1α stability through ROS. (A) Nuclear extracts from shNS and shSIRT3 HEK293T cells treated with or without 10 μM MG-132 for 1 hour or 1 mM DMOG for 4 hours as indicated were immunoblotted with antibodies specific to hydroxylated HIF1α (HIF-OH) or total HIF1α. (B) Fold induction of HIF1α target genes in response to hypoxia (n = 6) measured by qRT-PCR. The ratio of hypoxic to normoxic gene expression is shown. (C) Fold induction of Glut1 and Hk2 in response to DMOG treatment was measured by qRT-PCR and the ratio of untreated to DMOG-treated gene expression is shown (n = 6). (D) The increase in ROS production with hypoxia was calculated as the fold change in ROS in hypoxic cells relative to normoxic controls. (E) Immunoblots of SIRT3 WT and KO MEFs incubated with 10 mM N-acetylcysteine (NAC) and cultured under hypoxia. (F) Immunoblots of SIRT3 WT and KO MEFs cultured at 21% O2 with 10 mM NAC or 1 mM DMOG as indicated. (G) Glut1 expression was measured by qRT-PCR in SIRT3 WT and KO MEFs (n = 5) that were incubated with 10 mM NAC and cultured under hypoxia. Significance was assessed by one-way ANOVA. (G) Growth curves of SIRT3 WT and KO MEFs (n = 3) cultured in standard media or media supplemented with 10 mM NAC. Error bars, ±SD. Protein carbonyls (I) and lipid peroxidation (J) were measured in brown adipose tissue (BAT) of SIRT3 WT and KO mice (n = 7). (K) qRT-PCR analysis of Glut1 expression in BAT of SIRT3 WT and KO mice treated with 40 mM NAC. β-2-microglobulin or Rps16 were used as endogenous controls. Error bars (except for growth curves), ±SEM. (*) p < 0.05; (**) p < 0.01. See also Figure S4.

