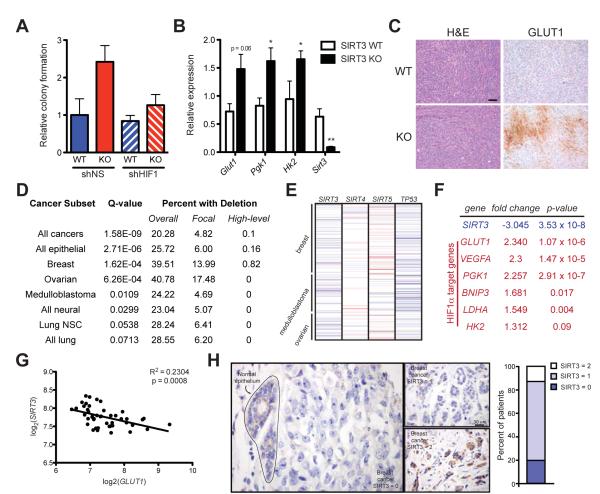
Figure 5.
SIRT3 is significantly deleted in human breast cancer. (A) Soft agar assays using transformed SIRT3 WT and KO MEFs expressing shNS or shRNA against HIF1α (shHIF1) (n =4). (B) Quantitative RT-PCR on RNA isolated from xenograft tumors and normalized to expression of 36B4. (C) Hematoxylin and eosin (H&E) staining (left) and immunohistochemial analysis of GLUT1 expression (right) in xenograft tumors. One representative pair of contralateral tumors is shown. Scale bar, 50 μm. (D) Table summarizing SIRT3 deletion frequency across a panel of human tumors. (E) Schematic of copy number changes at the SIRT3-5 and TP53 loci. Amplifications are shown in red; deletions are shown in blue. (F) Expression levels of SIRT3 and several HIF1α target genes were determined using the Oncomine cancer microarray database (http://www.oncomine.org) in normal versus breast cancers. (G) Linear regression of SIRT3 and GLUT1 across the panel of normal and breast cancer samples described in (F). (H) Representative image of SIRT3 expression in normal breast epithelium and in breast tumor cells as assessed by immunohistochemistry. SIRT3 levels were classified as absent (0), weak scattered (1) or positive as strong (2) compared to normal epithelium and the percentage of patients classified in each category is depicted in histogram at right. Error bars, ±SEM (n = 4-6). (*) p <0.05; (**) p <0.01. See also Figure S5.

