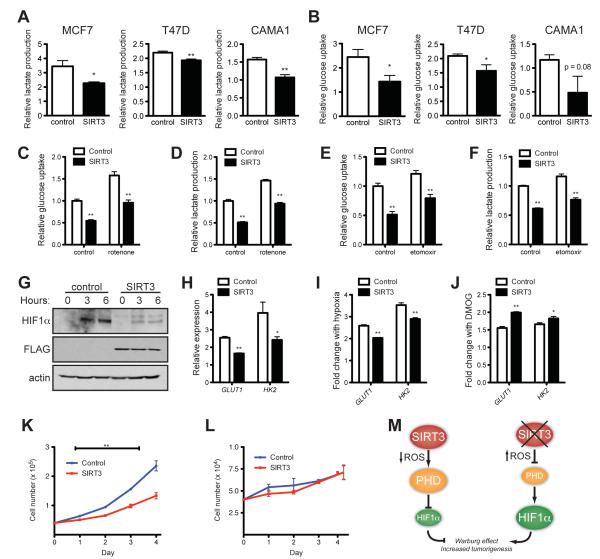
Figure 6.
SIRT3 suppresses the Warburg effect in human breast cancer cells. (A) Lactate production and (B) glucose consumption of MCF7, T47D and CAMA1 cells stably expressing empty vector or SIRT3 and cultured under hypoxia expressed as a ratio of empty-vector normoxic controls. (C) Relative glucose uptake and (D) relative lactate production in CAMA1 control or SIRT3 overexpressing cells incubated with or without 100 nM rotenone. (E) Glucose uptake and (F) lactate production in CAMA1 cell lines cultured in the presence or absence of 50 μg/ml etomoxir. (G) Immunoblots of CAMA1 cells stably expressing control vector or SIRT3-FLAG cultured at 1% oxygen for the indicated. (H) qRT-PCR of HIF1α target genes in CAMA1 cells cultured at 1% oxygen. (I) Induction of HIF1α target genes in response to hypoxia measured by qRT-PCR in CAMA1 cells. The ratio of normoxic to hypoxic gene expression in each cell line is shown. (J) Induction of HIF1α target genes in response to 1 mM DMOG treatment measured by qRT-PCR in CAMA1 cells. The ratio of untreated to DMOG-treated gene expression in each cell line is shown. Growth curves of CAMA1 cells (n =3) cultured in glucose (K) or galactose (L). Error bars, ±SD. (M) Schematic of the regulation of HIF1α and the Warburg effect by SIRT3. β-2-microglobulin was used as an endogenous control for qRT-PCR. Error bars (except for growth curves), ±SEM. (*) p <0.05; (**) p <0.01. See also Figure S6.

