
Figure 1.
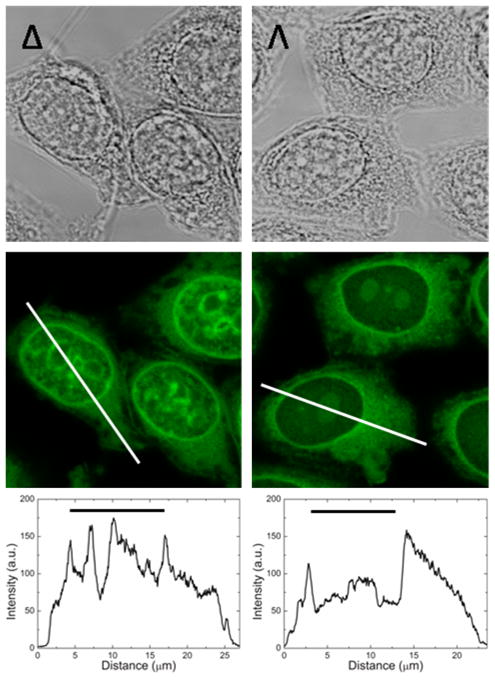
Representative transmission (upper) and emission confocal laser scanning (middle) images of the intracellular distribution of Δ- and Λ-D4 in fixed CHO-K1 cells. The lower panel shows intensity profile plots resolving intracellular differences in emission intensity of the two enantiomers. The black horizontal bars indicate the location of the nucleus. Laser intensity and photo multiplier gain are the same in both images, and intensities are thus directly comparable.