
Figure 2.
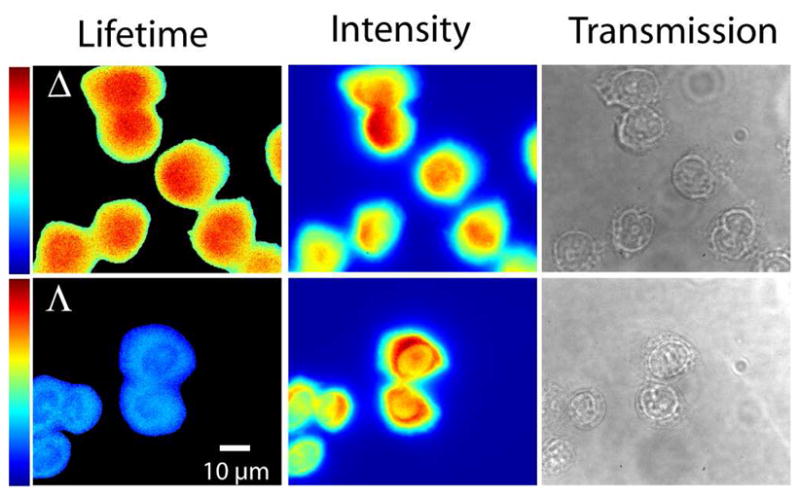
False color fluorescence lifetime images (left), emission intensity images (middle) and transmission images (right) of Δ- and Λ-D4 in fixed CHO-K1 cells showing the enantiospecific difference in apparent intracellular lifetime as well as their different lifetime distributions. FLIM color bars: 200–360 ns.