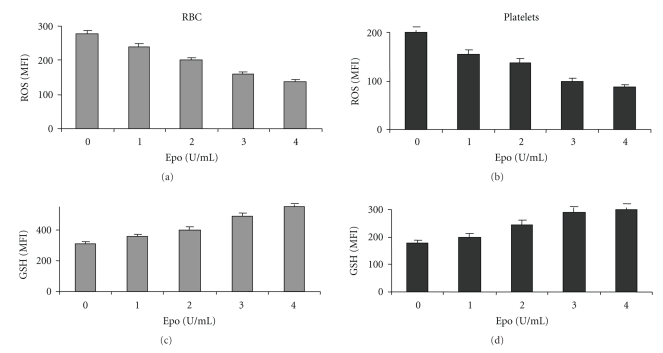
Figure 4.
The Epo dose-effect relationship on ROS and GSH of thalassemic RBC and platelets. Diluted blood samples were exposed to different concentrations of Epo for 2 hrs at 37°C and then stimulated with 1 mM H2O2 for 15 min. The results show the average (N = 4) mean fluorescence index (MFI) ± SD of ROS and GSH in RBC and platelets.

