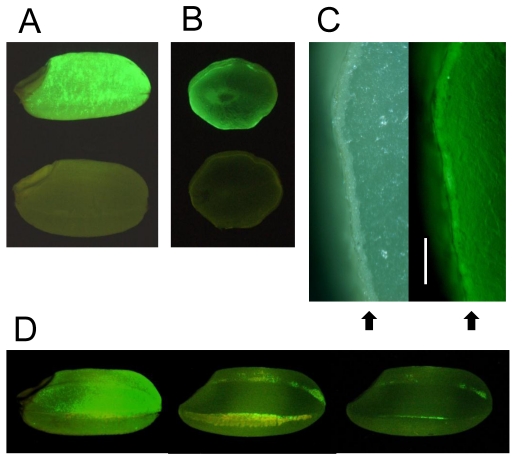
Fig 1.
Detection of GFP fluorescence in seeds (brown rice). (A) Transgenic brown rice (upper seed) and non-transgenic brown rice (lower seed). (B) Transverse sections of transgenic brown rice (upper seed) and non-transgenic brown rice (lower seed). (C) Aleurone layer in transverse section of transgenic brown rice. Right panel shows fluorescence view. Bar indicates 200 μm. Arrows show aleurone layer. (D) Effects of polishing transgenic brown rice: non-polished rice (left seed, weight: 21.3 mg), the roughly polished rice (middle seed), and the polished rice (right seed, weight: 19.1 mg, rice-polishing rate: 89.3%). The yellow region of roughly polished rice is bran layer. A fluorescence stereo-microscope (Nikon SMZ800) was used to observe GFP fluorescence.

