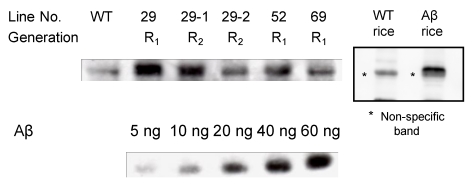
Fig 3.
Determination of Aβ42 expression levels. Brown rice samples were subjected to SDS-PAGE with Aβ42 at increasing concentration (5, 10, 20, 40 and 60 ng). Approximately 0.15 mg of crushed seeds was applied to each lane. R0 seeds (R1 generation) and R1 seeds (R2 generation) were used. WT; non-transgenic rice; R1, R0 progeny; R2, R1 progeny. Faint band in WT is non-specific band just below Aβ42 band.

