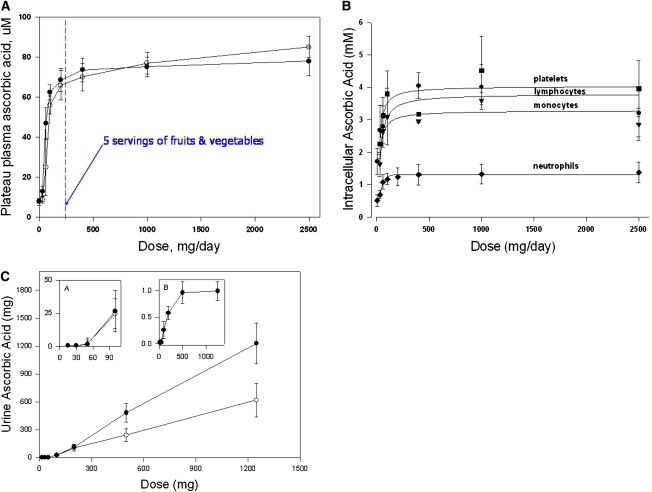
Figure 1.
(A) Plasma vitamin C concentrations as a function of dose. The relationship between oral doses of vitamin C and the mean fasting steady-state plasma vitamin C concentration in 7 healthy men and 15 healthy women are shown. The daily doses of vitamin C were: 30, 60, 100, 200, 400, 1000, and 2500 mg. The dose concentration curve is sigmoidal with its steep portion between 30 and 100 mg of vitamin C daily. Plasma vitamin C concentrations likely to be attained by the consumption of 5 servings of fruits and vegetables per day (containing ∼200 mg of vitamin C) are also shown. It is possible that vitamin C bioavailability from fruits and vegetable is less than that from oral doses of pure vitamin C in solution. Adapted from (18) and (21). (B) Intracellular vitamin C concentrations in circulating cells as a function of dose in healthy women. Cells were isolated when steady state was achieved for each dose. Reproduced from (21) with permission of The National Academy of Sciences, Washington DC. (C) Urinary vitamin C excretion as a function of single vitamin C doses at steady state in 7 healthy men. Vitamin C excretion over 24 h was determined after administration of single doses given either orally or i.v. (Inset A) Vitamin C excretion for single oral or intravenous doses of 15–100 mg. x-axis indicates dose, y-axis indicates amount (mg) excreted in urine. (Inset B) Fractional excretion (the fraction of the dose excreted) after i.v. administration of single doses of vitamin C. x-axis indicates dose, y-axis indicates fractional excretion (vitamin C excreted in urine in milligrams divided by the vitamin C dose in milligrams). Reproduced from (18) with permission of The National Academy of Sciences, Washington DC.

