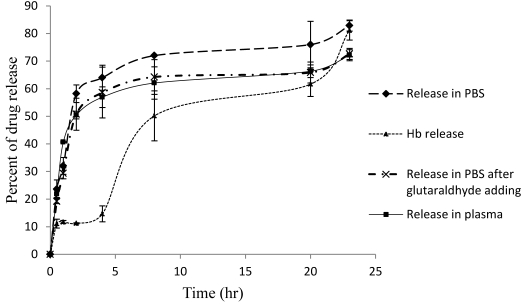
Figure 4.
Percent of pravastatin and hemoglobin release from loaded erythrocytes in PBS and plasma. Data were tested by one-way analysis of variance and represented as mean ± SD. Three samples in each group (N = 3). Bonferroni multiple comparison tests using SPSS software was performed to determine differences between mean values at (P ≤ 0.01).

