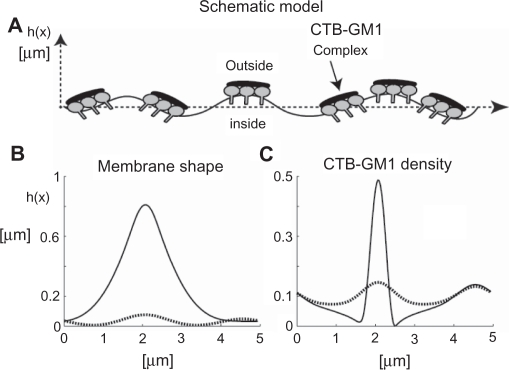
Figure 6.
The effects of cholera toxin B (CTB) binding to GM1 molecules on membrane shape and filament densities. A) The schematic model is a nearly straight membrane contour, which describes a segment of an RT4 or T24 cell. Numerical simulations of the flat shape membrane reveal the steady state shapes of membrane amplitudes B) and CTB–GM1 densities C), given that α = 0.013 and H̄ = 5 μm−1 (see Supplementary material for more information). The amplitude h(x) is the value of the membrane deformation. The initial condition is a flat membrane with a random perturbation of small amplitudes (<1%) in the CTB–GM1 density around the uniform value of n0 = 0.1. The intermediate time (in dotted line) is after 400 seconds, and the steady state time (in bold line) is reached within 600 seconds.

