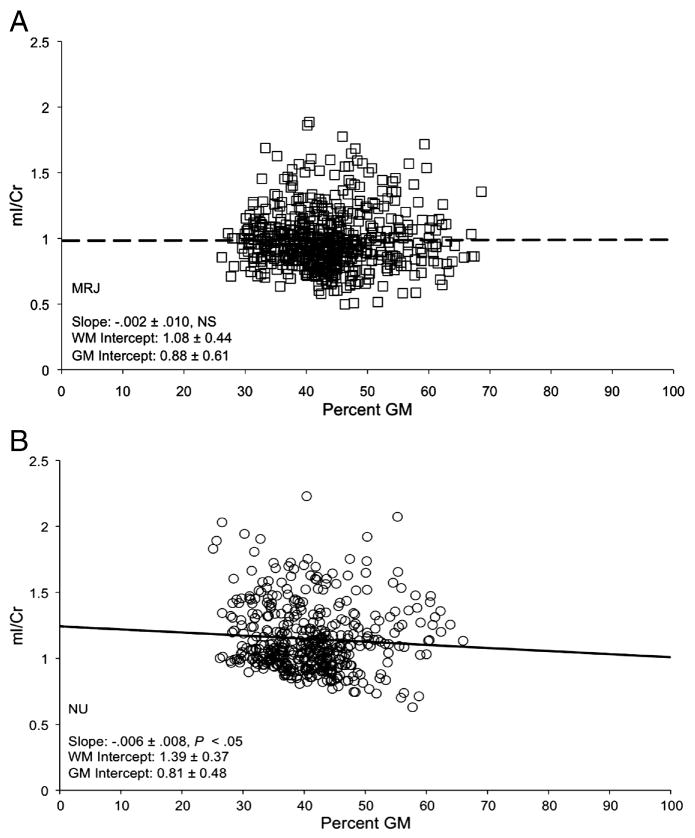
Figure 3.
A,B. Group regression plots of mI/Cr levels as a function of %GM for all subjects in each group for all voxels with high quality spectra. Individual data/regression lines in Figure 3A represent the MRJ group, open squares a with dashed line, and in Figure 3B, the NU group, open circles with a solid line. Slopes of the linear regression were calculated per subject (data not shown), and group averages demonstrated that slopes were not significantly different from zero in the MRJ group (slope=.001±.002, P=. 49), but were significantly different in the NU group (slope= −.009±.003, P=.05).

