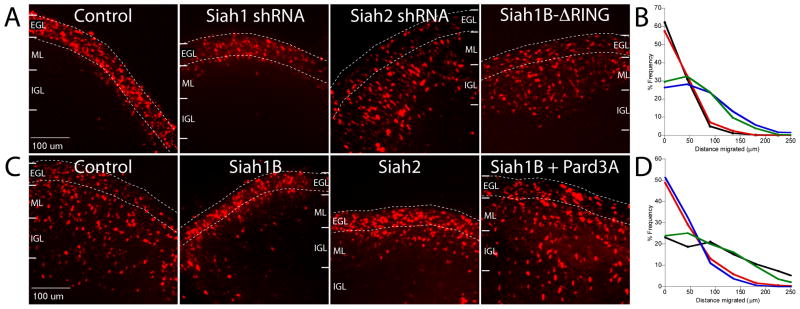
Figure 2. Siah activity attenuates GZ exit by negatively regulating Pard3A.
P8 EGL was co-electroporated with the indicated expression constructs and H2B-mCherry. After 24 (A) or 48 (C) hours of ex vivo culture, the migration distance of H2B-labeled CGN from the pial layer (outer dashed line) was analyzed in 3 imaging experiments. (A) Most control and Siah1B-silenced cells remain within the EGL (dashed lines) at 24 h, while Siah2-silenced and Siah1B-ΔRING over-expressing cells pre-maturely entered the ML and IGL. (B) Migration distance versus frequency plot of control (n=872, black), Siah1B-silenced (n=960, red), Siah2-slienced (n=926, blue) or Siah1B-ΔRING over-expressing (n=927, green) CGNs. (C) While control cells entered the ML and IGL after 48 h, Siah1B and Siah2 over-expressing cells remained in the EGL. Addition of Pard3A to Siah-expressing CGNs restored migration. (D) Migration distance versus frequency plot of control (n=909, black), Siah1B-expressing (n=970, red), Siah2-expressing (n=921, blue) or Siah1B+Pard3A-expressing (n=919, green) CGNs.

