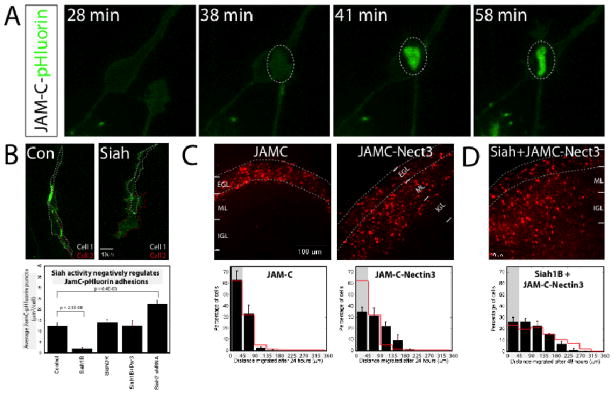
Figure 4. Siah activity regulates GZ exit by modulating the formation of Pard3A-dependent JAM-C adhesions.
(A) Time lapse imaging of CGNs nucleofected to express JAM-C-pHluorin. Fluorescence is low before cell contact. Upon establishment of stable contacts, JAM-C-pHluorin signal fluorescence intensifies. (B) Purified CGNs were electroporated to co-express JAM-C-pHluorin and the indicated constructs. After 18 h, the abundance of JAM-C-pHluorin contacts were analyzed. Control cells (n=64 cells, 16045 puncta) displayed robust JAM-C contacts. Siah expression (n=37 cells, 2579 puncta) significantly reduced JAM-C-pHluorin–positive puncta. Siah1B-ΔRING (n=30 cells, 7589 puncta) and Siah1B+Pard3A (n=32 cells, 8069 puncta) cells were similar to controls, while Siah2 silencing (n=34 cells, 10709 puncta) increased JAM-C-pHluorin contact. (C, D) CGNs in P8 EGL were co-electroporated with the indicated constructs and H2B-mCherry. After 24 or 48 h of culture, the distance of H2B-labeled cells from the pial layer (outer dashed line) was analyzed in three separate experiments. Grey shading shows percentage of cells found in the EGL; red overlay indicates the average migration distribution of control cells (error bar, SD). (C) JAM-C over-expression (n=891) did not induce migration from the EGL, but the JAM-C-Nectin3 fusion molecule (n=874), a Pard3A independent JAM-C variant, induced CGN migration from the EGL at 24 h. Control vs JAM-C, p=0.58; vs JAM-C-Nectin3, p=5.50×10⁻²⁶ (χ2 test). (D) JAM-C-Nectin3 (n=971) expression rescues migration of Siah1B-expressing cells. Control vs Siah1B+JAM-C-Nectin3, p=0.95 (χ2 test).

