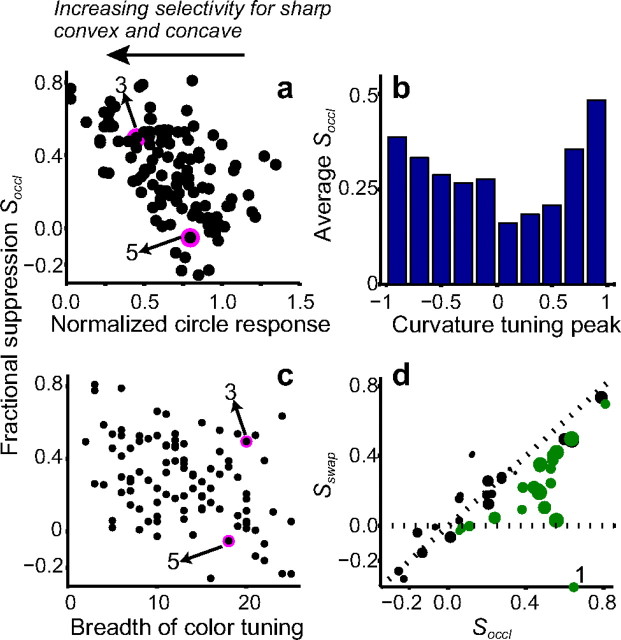
Figure 6.
Population results. a, Each dot denotes data from a cell. x-Axis, Circle response normalized by the maximum primary shape response. Cells that preferentially encode broad convexities lie close to 1.0 on this axis, whereas cells that encode sharp convexities and concavities lie close to 0.0. y-Axis, Fractional suppression, which quantifies the difference between primary shape and combination stimulus responses for stimuli that elicited greater than half-maximum response (see Materials and Methods). Across the 129 neurons, the number of stimuli with responses greater than half-maximum ranged from 0 (for 11 cells) to 40 (mean of 11.4, median of 10). Thus, 118 cells are included in this figure. Magenta circles plot fractional suppression of example cells in figures denoted by the numbers; these values were based on 12 (Fig. 3) and 20 (Fig. 5) stimuli that exceeded half-maximum. There was a negative correlation (r = −0.56) between normalized circle response and fractional suppression: cells selective for sharp convexities or concavities exhibited stronger suppression than those selective for broad convexities. b, Average fractional suppression as a function of tuning peak along the curvature axis. Contour curvature is plotted along the x-axis: −1 represents deep concavities and +1 sharp convexities. y-Axis shows average fractional suppression across neurons with curvature-tuning peaks in the corresponding bin. c, Breadth of color tuning (x-axis) versus fractional suppression, Soccl (y-axis). Breadth of color tuning is given by the number of colors that evoked greater than half the maximum responses at the most responsive luminance on the color characterization test (see Materials and Methods). Thus, cells with weaker color tuning are associated with greater breadth of tuning. The example cells in Figures 3 and 5 (labeled) show equally broad color tuning but very different Soccl values. Across the population, there was a negative correlation (r = −0.42) between breadth of color tuning and fractional suppression. d, x-Axis, Soccl, fractional suppression for combination stimuli; y-axis, Sswap, fractional suppression for swapped location control stimuli, i.e., for primary and context stimuli presented in the interchanged spatial locations. Dot size is inversely proportional to normalized circle response. Cells with smaller circle response (larger dots) lie below the diagonal (Soccl > Sswap). Green dots denote cells for which Soccl was significantly greater than Sswap. Cells with large circle response (small dots) lie along the diagonal (Soccl ≈ Sswap) and close to the origin (Soccl and Sswap are small in magnitude). For the cell labeled 1 on the x-axis, Sswap = −0.8.

