
Figure 9.
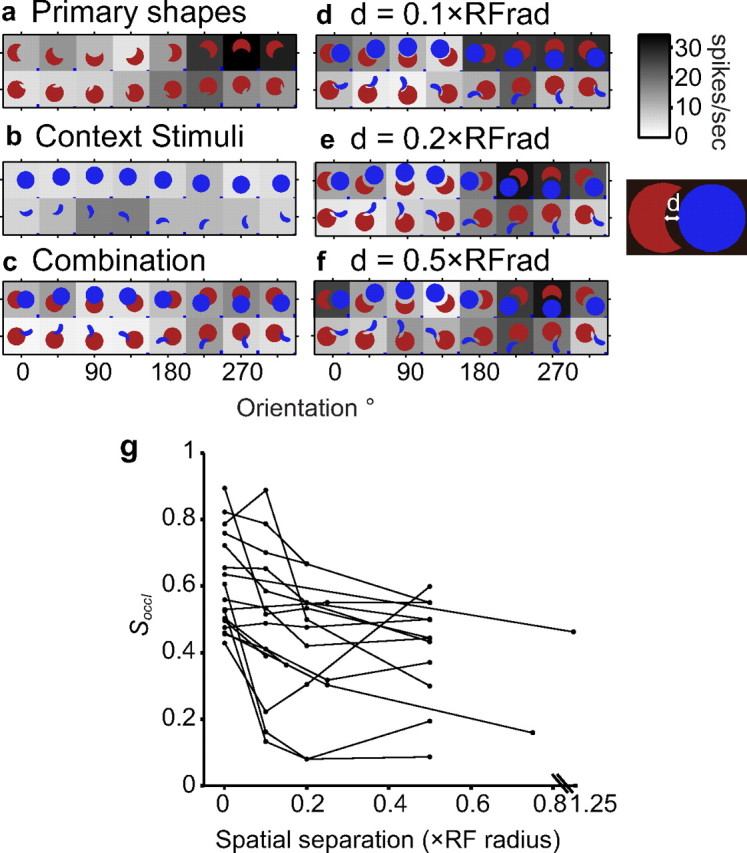
Spatial separation results: example and population. a–f, Example cell. All conventions as in Figure 3. a, Primary shape responses. This neuron responded preferentially to shapes with a sharp convexity adjoined by a concavity at the bottom. b, Responses to contextual stimuli were uniformly weak. c, Combination responses reflect suppression of preferred primary shape responses under partial occlusion context. d–f, A small spatial separation (d, 0.1 × RF radius; e, 0.2 × RF radius; f, 0.5 × RF radius) between primary and contextual stimuli dramatically decreased suppression. g, Population results. Spatial separation (x-axis) versus fractional suppression (y-axis). Most neurons (14 of 17; see Results) show a negative correlation between fractional suppression and spatial separation. Note for the interrupted x-axis: for one neuron, the maximum separation tested was d = 1.25 × RF radius.