
Figure 2.
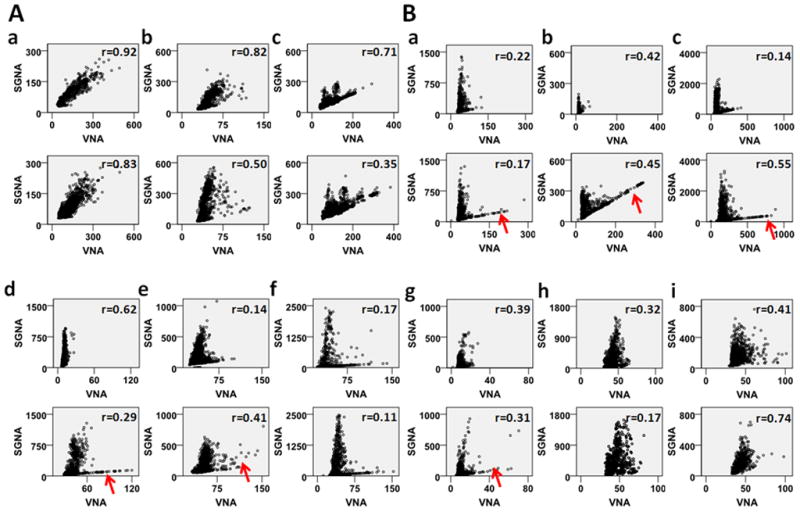
Sympathovagal correlations of all dogs studied. Panels A and B show dogs with excellent correlations (Group 1) and poor correlations (Group 2), respectively. The dogs of Group 2 show “L-shaped” correlation. However, because this designation is subjective, it is not used to determine the grouping of the dogs. The upper panels show the baseline correlation, while the lower panels show correlation in the week before the development of sustained AF. We used the same scales of the ordinate and abscissa within each dog to facilitate the comparison. The red arrows point to apparent increase of lower (vagal) arm of the correlation in six Group 2 dogs prior to the onset of sustained AF. All units are mV-s.