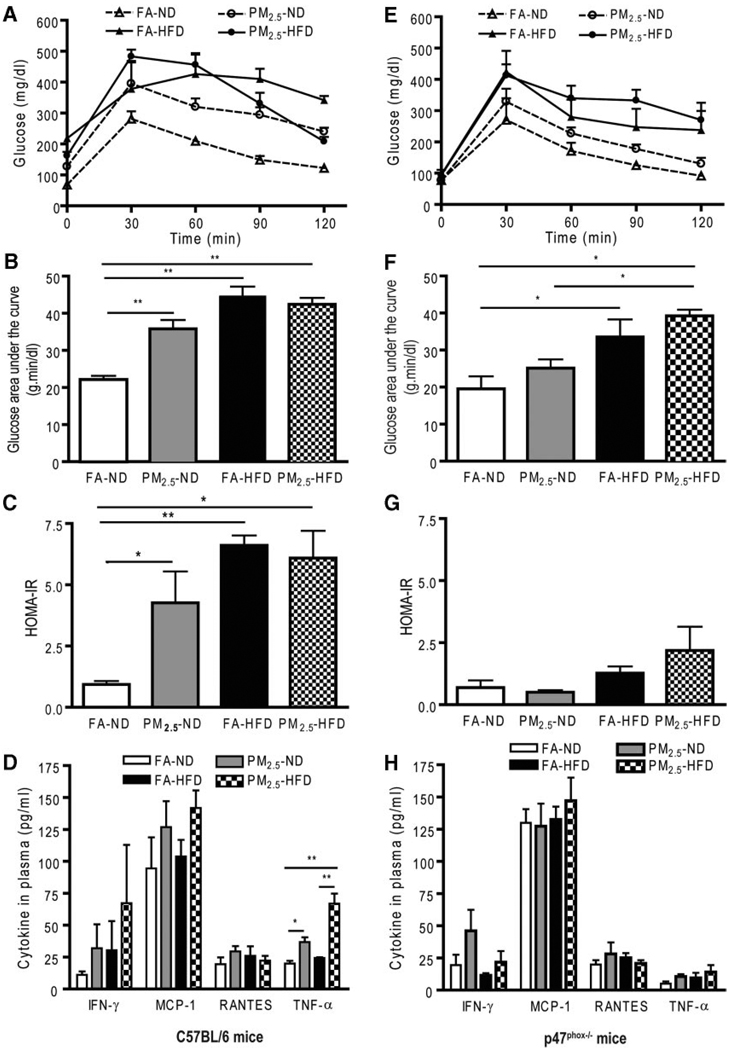
Figure 1.
Glucose homeostasis and systemic inflammation in wild-type C57BL/6 mice and p47phox−/− mice by ambient PM2.5 exposure compared with FA-exposed mice fed an ND (n = 16) or an HFD (n = 16). A and E, Effect of PM2.5 exposure on glucose tolerance by intra-peritoneal glucose tolerance test (IPGTT) in C57BL/6 mice and in p47phox−/− mice, respectively. B and F, The glucose area under the curve calculated from the glucose tolerance test from parts A and E, respectively. C and G, The homeostasis model assessment IR index in C57BL/6 mice and in p47phox−/− mice, respectively. D and H, Plasma cytokine measurement by ELISA in C57BL/6 mice and in p47phox−/− mice, respectively. n = 8 in each group. *P<0.05 and **P<0.001. IFN indicates interferon; MCP-1, monocyte chemoattractant protein-1; RANTES, regulated on activation, normal T cell expressed and secreted (or chemokine C-C motif ligand 5).

