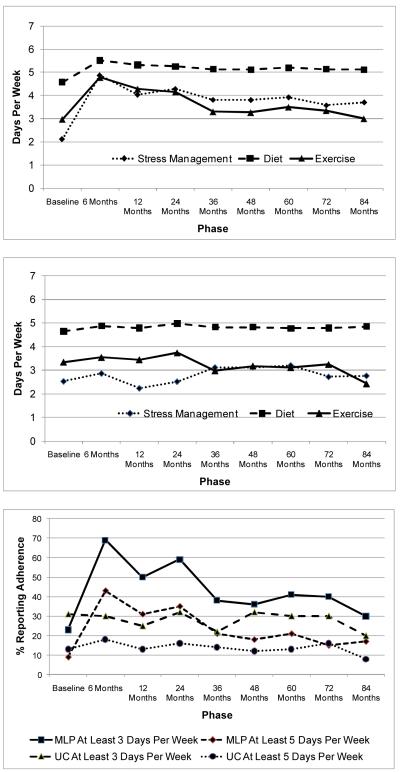
Figure 1.
Adherence to Diet, PA, and Stress-management Targets
Note.
Graph 1 = MLP self-monitored days/week of achieving PA, diet, and stress-management targets. Graph 2 = UC self-monitored days/week of achieving PA, diet, and stress-management targets. Graph 3 = Percent of MLP and UC adhering to each of the 3 targets at least 3 or 5 days per week.

