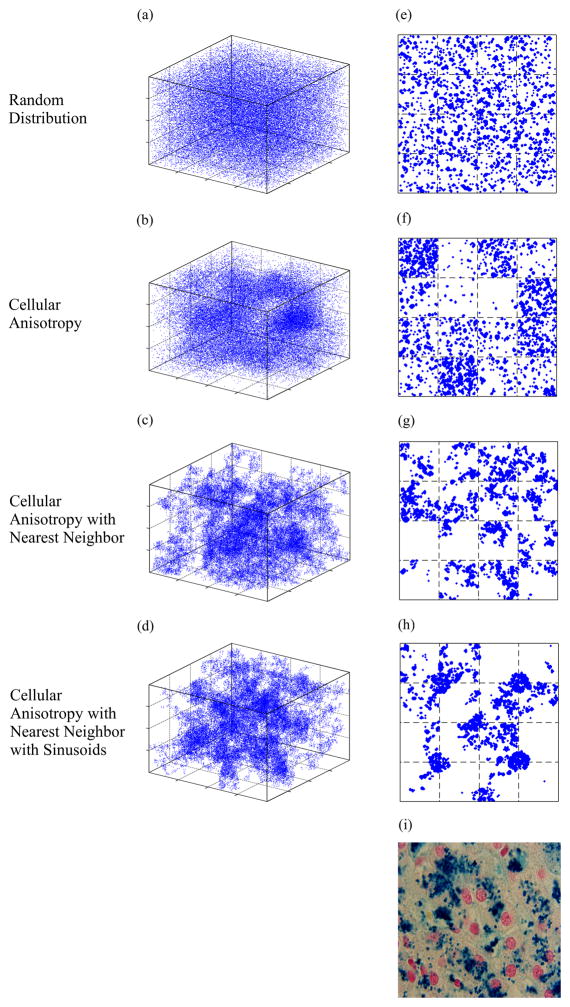
Figure 3.
Illustration of variants of virtual liver iron morphology that were generated for an iron concentration of 20 mg/g dry tissue weight. Panels (a-d) show the distribution of centers of iron spheres (blue) in the three dimensional tissue environment. Panels (e-h) are 4 μm thick random sections of the corresponding 3D volumes accounting for individual sphere dimensions. Panel (i) is a real histological section from a patient with 19.2 mg/g HIC; note the striking similarity between (h) and (i).

