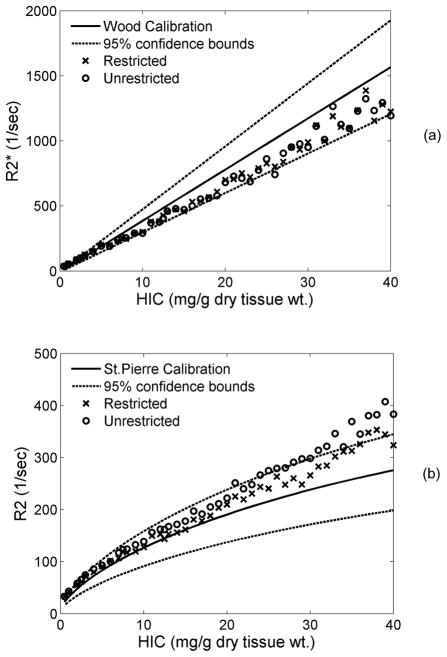
Figure 6.
Plots demonstrate the effect of the presence of anatomical boundaries on R2* (a) and R2 (b). In restricted diffusion, protons were not allowed to pass through cell boundaries. Sinusoids were included in the liver geometry. R2* was unaffected while R2 dropped by 8% when proton motion was restricted as compared to unrestricted.

