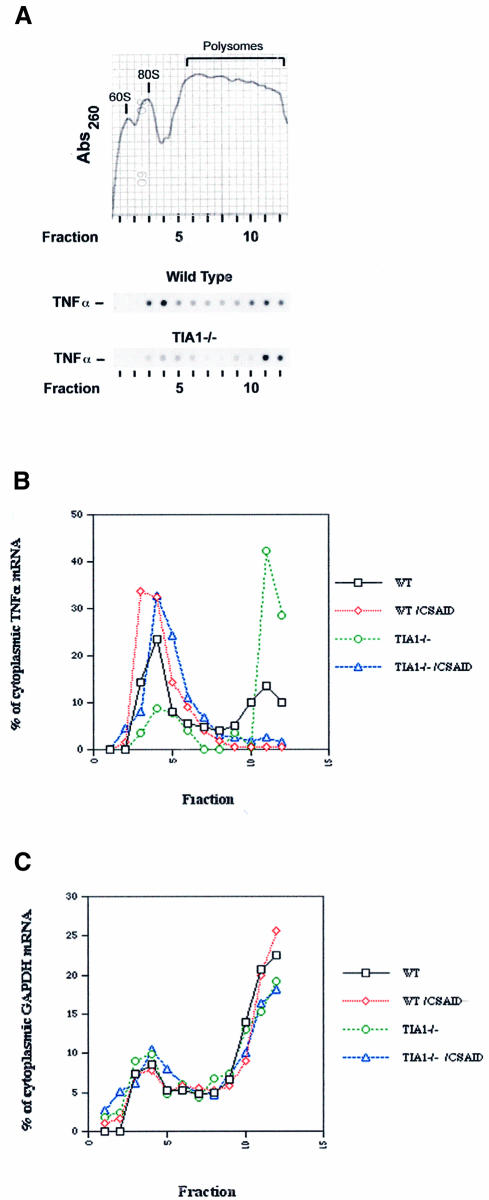
Fig. 6. Sucrose gradient analysis. Peritoneal macrophages were activated with LPS in the absence or presence of the CSAID SB202190 (5 µM) for 2 h. Cell lysates were layered over a 20–47% sucrose gradient and centrifuged at 40 000 r.p.m. for 3 h. (A) Representative profile of the 260 nm UV absorption across the gradients. The profile shown was obtained from wild-type cell lysates in the absence of CSAID; the absorption peaks corresponding to the 60S, 80S and polysome-containing fractions are indicated. Analyses from TIA-1–/– lysates were virtually identical. TNF-α mRNA levels in individual fractions from wild-type and TIA-1–/– lysates were determined by hybridization and autoradiography. Quantitation of TNF-α (B) and GAPDH (C) transcripts in individual fractions was determined by densitometry. Black squares, wild-type macrophages; red diamonds, wild-type macrophages plus CSAID; green circles, TIA-1–/– macrophages; blue triangles, TIA-1–/– macrophages plus CSAID.

An official website of the United States government
Here's how you know
Official websites use .gov
A
.gov website belongs to an official
government organization in the United States.
Secure .gov websites use HTTPS
A lock (
) or https:// means you've safely
connected to the .gov website. Share sensitive
information only on official, secure websites.
