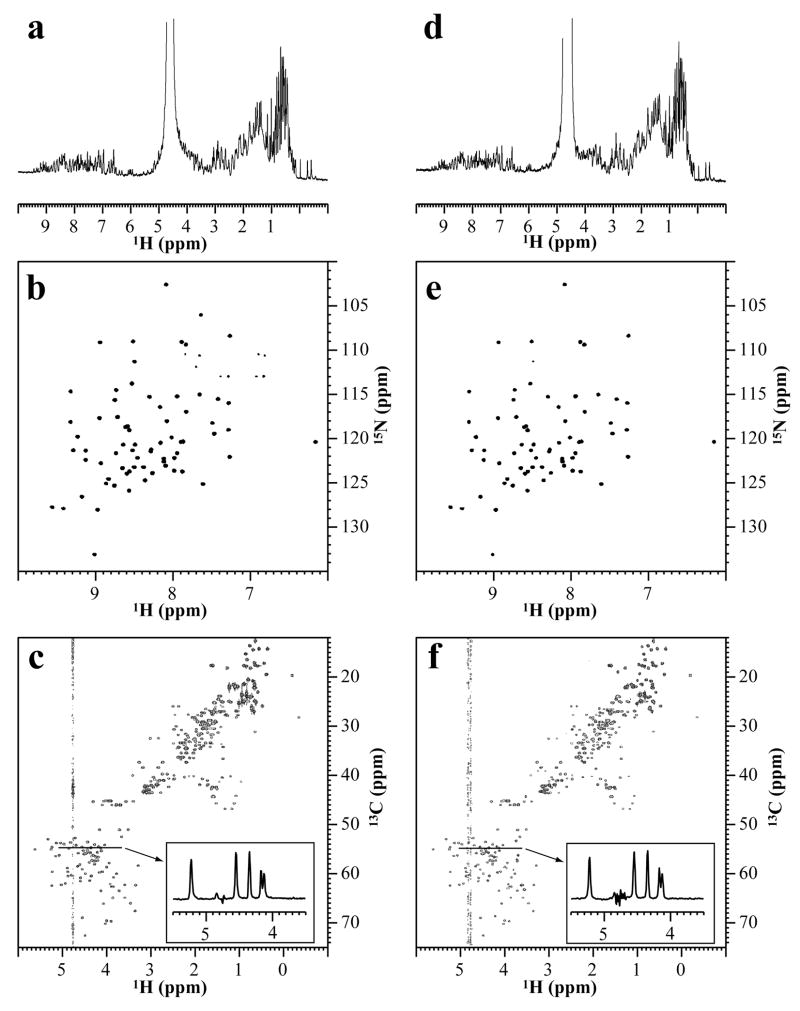
Figure 3. Comparison of NMR spectra acquired with the slot tube and the 5 mm microtube.
NMR spectra of 0.3 mM of [U-13C/15N]-ubiquitin containing 10 mM sodium phosphate (pH 6.6) in the 5 mm microtube (a–c) and the slot tube (d–f). All these data were acquired on an Avance950 NMR spectrometer (22.3 T) equipped with a TCI cryogenic probe at 25°C. (a, d) 1H 1D experiment with the water peak was suppressed by continuous wave irradiation at a fixed RF transmitter power. (b, e) 1H-15N TROSY-HSQC experiments with a water flip-back pulse. (NS=2; 512 (F1) × 1536 (F2) with 3,400 Hz (ω1, 15N) × 11,400 Hz (ω2, 1H)) (c, f) 1H-13C constant time HSQC experiments (NS=2; 916 (F1) × 1536 (F2) with 16,900 Hz (ω1, 13C) × 11,400 Hz (ω2, 1H)). The constant time was 26.6 ms and both positive and negative peaks are displayed. To clarify the relative intensity of the remaining water to the protein signals, the 1D slice of the experiments at 13C chemical shift of 55 ppm are displayed in the inset. The experimental conditions were identical between the 5 mm microtube and the slot tube except for the 1H pulse length.

