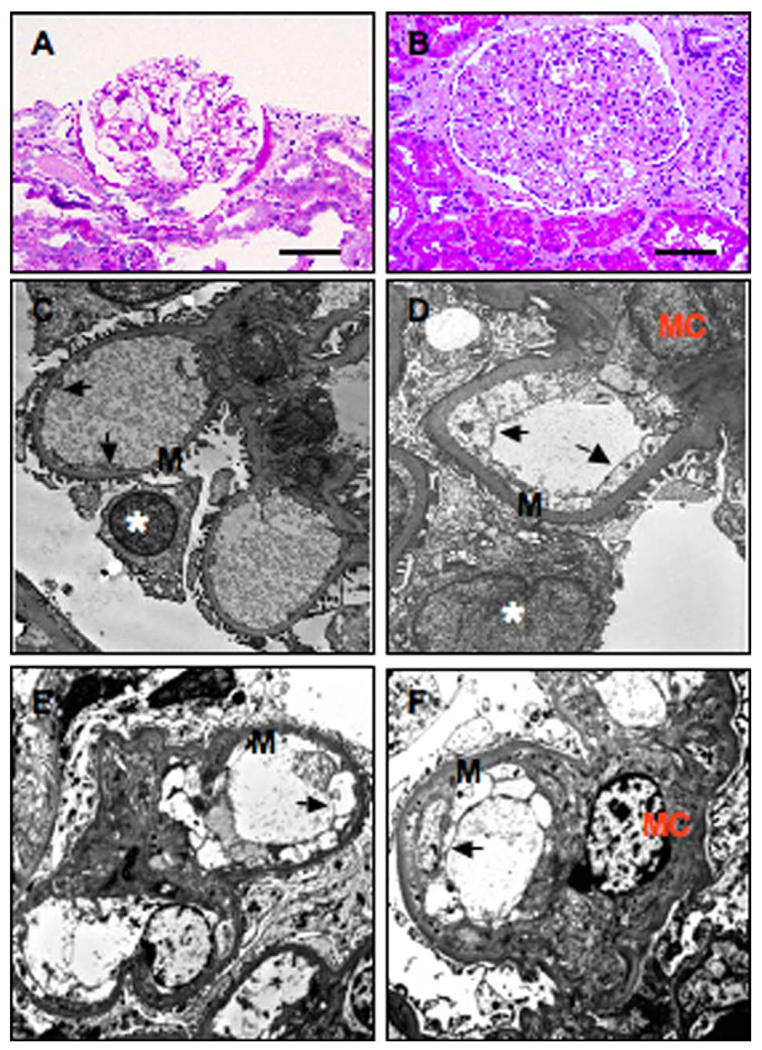
Figure 1.
Representative micrographs of HE staining and EM examination in kidney tissue sections from nonhypertensive and preeclamptic patients. A and C, Nonhypertensive. B and D–F, Preeclampsia. A and B, HE staining and C and D–F, Electron macroscopic micrographs. Arrow indicates glomerular endothelial cells; EM = electron microscopic; HE = hematoxylin and eosin; M = basement membrance; Asterisk = podocytes; MC = mesenchymal cells. Bar = 50 µm for A and B. Magnification: C: 5200×; D: 8900×; E: 8000×; and F: 8000×, respectively.

