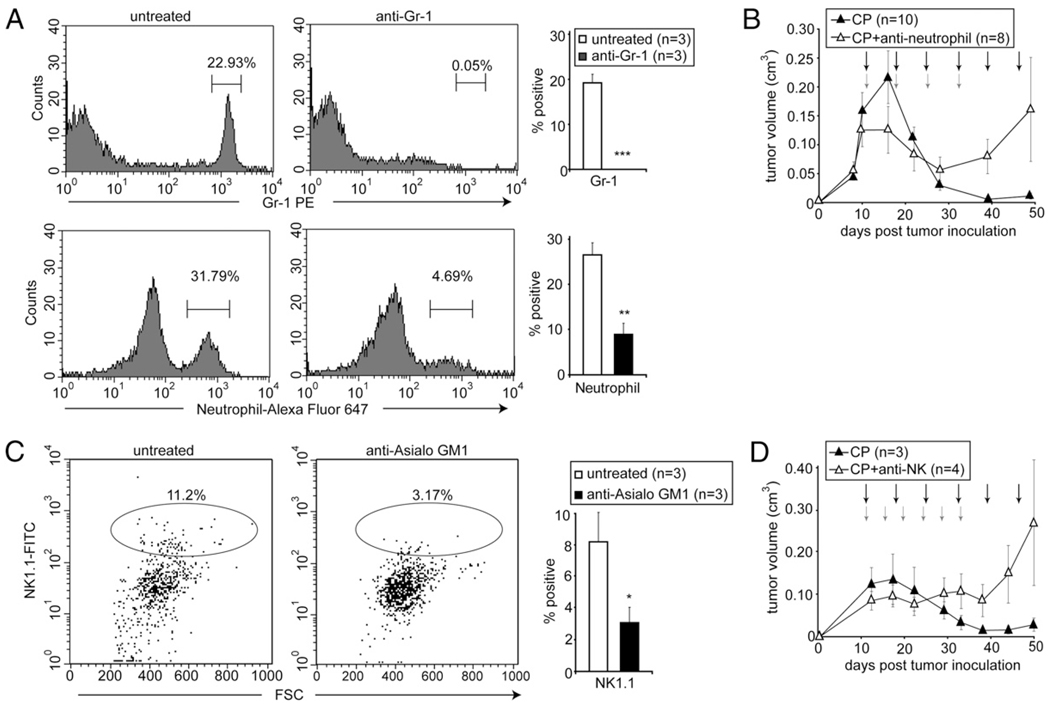
FIGURE 4.
Depletion of neutrophils or NK cells leads to tumor resistance to chemotherapy. Mice bearing tumors with endogenous HMGB1 were treated by i.p. injections with 170 mg/kg CP every 5 d (black arrows) alone, or in combination with (A, B) i.p. injections with 150 µg of the anti–Gr-1 neutrophil-depleting Ab in combination with the first four CP treatments (red arrows), or (C, D) i.v. injections with 25 µl of the NK cell-depleting Ab every 3 d (red arrows). A and C, Peripheral blood was collected and analyzed by flow cytometry using indicated Abs. Representative histograms for neutrophils (A) or dot plot for NK cells (C) are shown. Shown on the right are the averages from three animals in each group + SEM. *p < 0.05, **p < 0.005, ***p < 0.0005. B and D, Tumors were measured by caliper, and the average volume of tumors with SEM was plotted.

