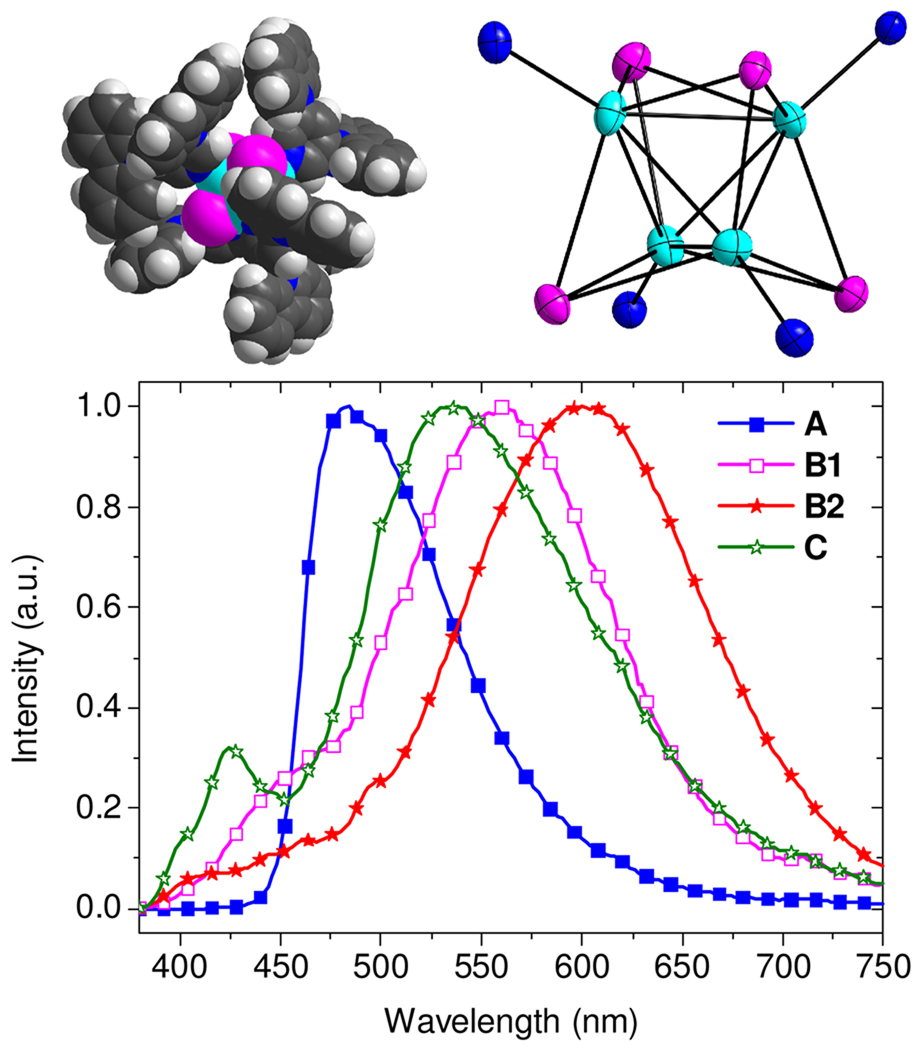
Figure 4.
Upper left: Space-filling drawing of [CuI(mCPy)]4·3CH2Cl2 (Model B1) from crystal coordinates. Upper right: ORTEP structure (50%) of the Cu4I4 core of B1 with only the coordinating N atoms of the mCPy ligands shown. Lower: PL spectra of [CuI(mCPy)]∞ (model A), B1, [CuI(mCPy)]4 (model B2), and ground CuI with mCPy (model C) with excitation wavelength of 350 nm.

