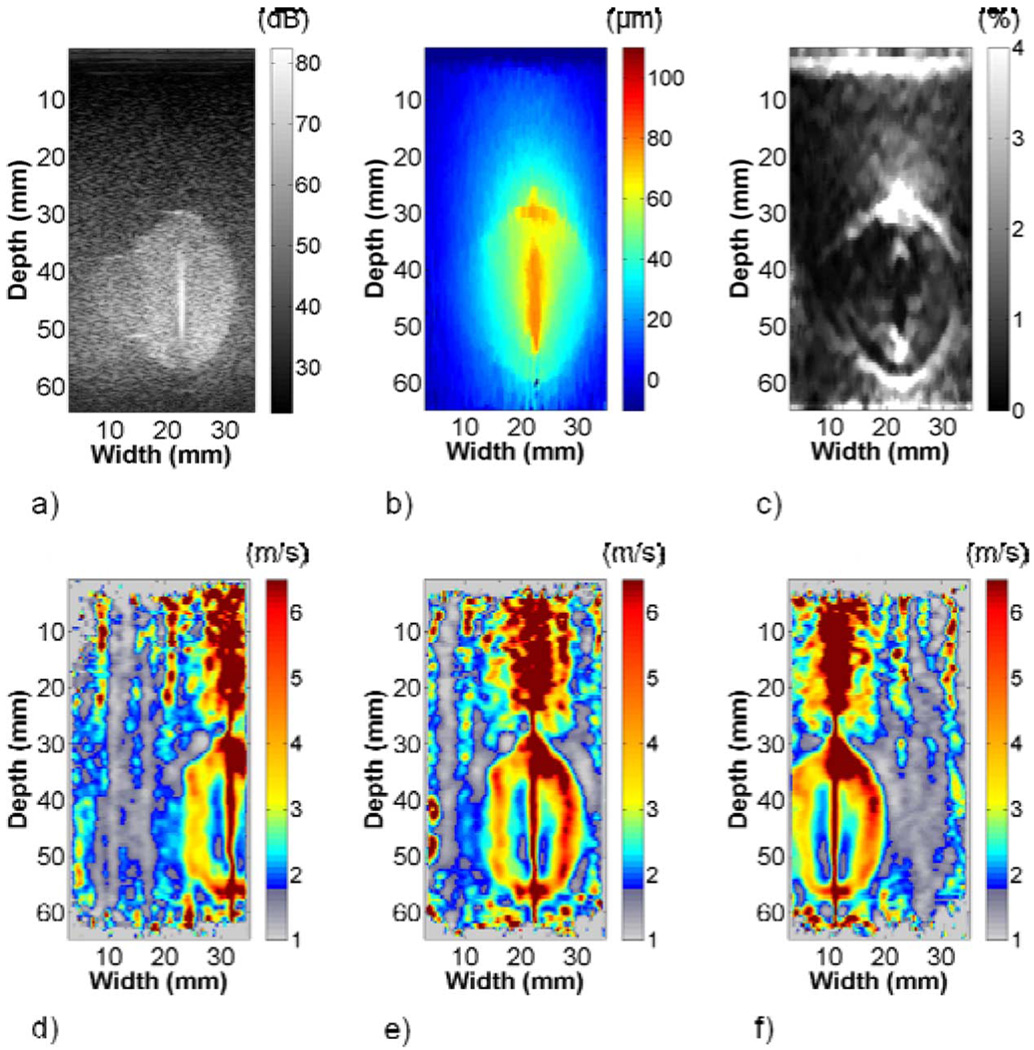
Fig. 8.
Representative (a) B-mode, (b) EDE displacement, (c) strain, and (d)–(f) shear wave velocity images (left, center, and right of ellipsoid) from phantom 2. The B-mode image clearly shows the simulated ablated region and partially ablated region. The decorrelation halo in the strain image delineates the simulated ablated region and partially ablated region from the softer background. The partially ablated region appears stiffer than the ablated region because of the lateral decay of the focused compression provided by the steel rod. The shear wave velocity images show the partially ablated region to be stiffer than the surrounding background but softer than the fully ablated region. A modified colormap was used because of the low modulus contrast between the partially ablated region and background.

